


零基础跳到高精地图
A year ago I was in an interview for a newsroom graphics job and the head of their graphics team asked me how I made maps like the ones in my portfolio. I started talking about my different processes with Javascript, D3.js, R/Python, QGIS, Mapbox, and/or command line GIS — how I used tools depending on what kind of map I was making and what kind of data I had.
一年前,我在一次新闻编辑室的图形工作中接受采访,他们的图形团队负责人问我如何制作像投资组合中的地图一样的地图。 我开始用Javascript, D3.js , R / Python , QGIS , Mapbox和/或命令行GIS讨论不同的过程-如何使用工具取决于我制作的地图类型和所拥有的数据类型。
The interviewer said my workflow sounded difficult to reproduce and to track from project to project. I was a little thrown by the comment because I always use the tools at my disposal that help me get the project done. Simple, right?
面试官说,我的工作流程听起来很难在项目之间进行复制和跟踪。 我对评论有些不满意,因为我总是使用可以帮助我完成项目的工具。 简单吧?
Since then, I’ve tried to challenge myself to make my process more transparent and reproducible. Making work reproducible for yourself and others is important because it holds us mapmakers and datavizers accountable for our actions behind the scenes. It helps weed out errors and inconsistencies that you might not notice without that layer of additional attention to what steps you take and what tools you use.
从那时起,我一直在挑战自己,以使我的过程更加透明和可重复。 使您自己和他人可复制的工作非常重要,因为它使我们的地图制作者和数据编辑者对我们在幕后的行为负责。 如果没有额外的注意力来关注您采取的步骤和使用的工具,它可以消除您可能不会注意到的错误和不一致。
I still find it hard. I’m not a developer by training; I’ve built reusable map code in R and Python before but I always end up feeling limited, like I need that one join tool from QGIS, and that one projection command in Mapshaper. I can’t help but jump around from program to program and from tool to tool.
我仍然很难。 我不是经过培训的开发人员; 之前我已经在R和Python中构建了可重用的地图代码,但最终总是感到局限,就像我需要QGIS中的一个连接工具和Mapshaper中的一个投影命令一样 。 我忍不住从一个程序到另一个程序,从一个工具到另一个工具。
Someone once said, “The enemy of art is the absence of limitations.” I work with what I know and try to figure out what I don’t. Sometimes the maps or visualizations I make may be limited by what tools are at my disposal, but this pushes me to learn and innovate at speed. Sometimes the tools I use don’t work very well together, and I have to try something different. Other times I have to remake a map a hundred times because the data needs to be updated, or the projection needs to be changed, or I need to re-frame the story. There have been projects where I’ve needed ten different tools to get my final product looking the way I want.
有人曾经说过: “艺术的敌人是没有限制。” 我用我所知道的工作,并试图弄清我所不知道的。 有时,我制作的地图或可视化效果可能会受到我可以使用的工具的限制,但这促使我快速学习和创新。 有时,我使用的工具不能很好地配合使用,因此我不得不尝试一些不同的方法。 其他时候,由于数据需要更新,或者投影需要更改,或者我需要重新构建故事,因此我不得不重新绘制地图一百次。 在某些项目中,我需要十种不同的工具来使最终产品看起来像我想要的样子。
You can imagine how challenging it might be to track the process; I decided to try anyway!
您可以想象跟踪流程可能会充满挑战。 我还是决定尝试!

Google launched its dataset search a couple weeks ago, a search engine that lets you search millions of publicly available datasets. Right after its launch, I spent a few minutes searching for “cats” (an obvious starting point), which brought me to a dataset of the estimated cat population by square kilometer for Great Britain as of 2015.
Google在几周前启动了数据集搜索 ,这是一个搜索引擎,可让您搜索数百万个公开可用的数据集。 发射后不久,我花了几分钟时间搜索“猫”(一个明显的起点),这使我得出了截至2015年英国按平方公里估算的猫数量的数据集 。
While the “map alarm” was going off in my brain, I also thought this would be an interesting project to track my workflow. One day, I might have a fully reproducible path from zero to map, but for now, I wanted to “show my work” on this small D3 interactive map. For this, I’ve focused on my workflow for the map itself, and not on building the rest of the page, which can be just as winding a process.
当“地图警报”在我的大脑中响起时,我还认为这将是一个跟踪我的工作流程的有趣项目。 有一天,我可能会拥有从零到地图的完全可复制的路径,但是现在,我想在这张小D3 交互式地图上“展示我的作品”。 为此,我专注于地图本身的工作流程,而不是构建页面的其余部分,这就像缠绕一个流程一样。

In the diagram below (because why just write when you can write with viz?), I tracked my process from getting the estimated cat population data to presenting it on a map. It’s not a single straight line, that’s for sure. With the data, I went through steps to prepare it for mapping, only to realize the scale was way too big. So, I circled back in order to get more data, re-prepare it, and re-map it.
在下面的图表中(因为为什么要在可以用viz书写时才写?),我跟踪了从获取估计的猫种群数据到将其显示在地图上的过程。 当然,这不是一条直线。 有了数据,我逐步进行了准备以进行映射的步骤,只是意识到规模太大了。 因此,我盘旋以获取更多数据,重新准备数据,然后重新映射。
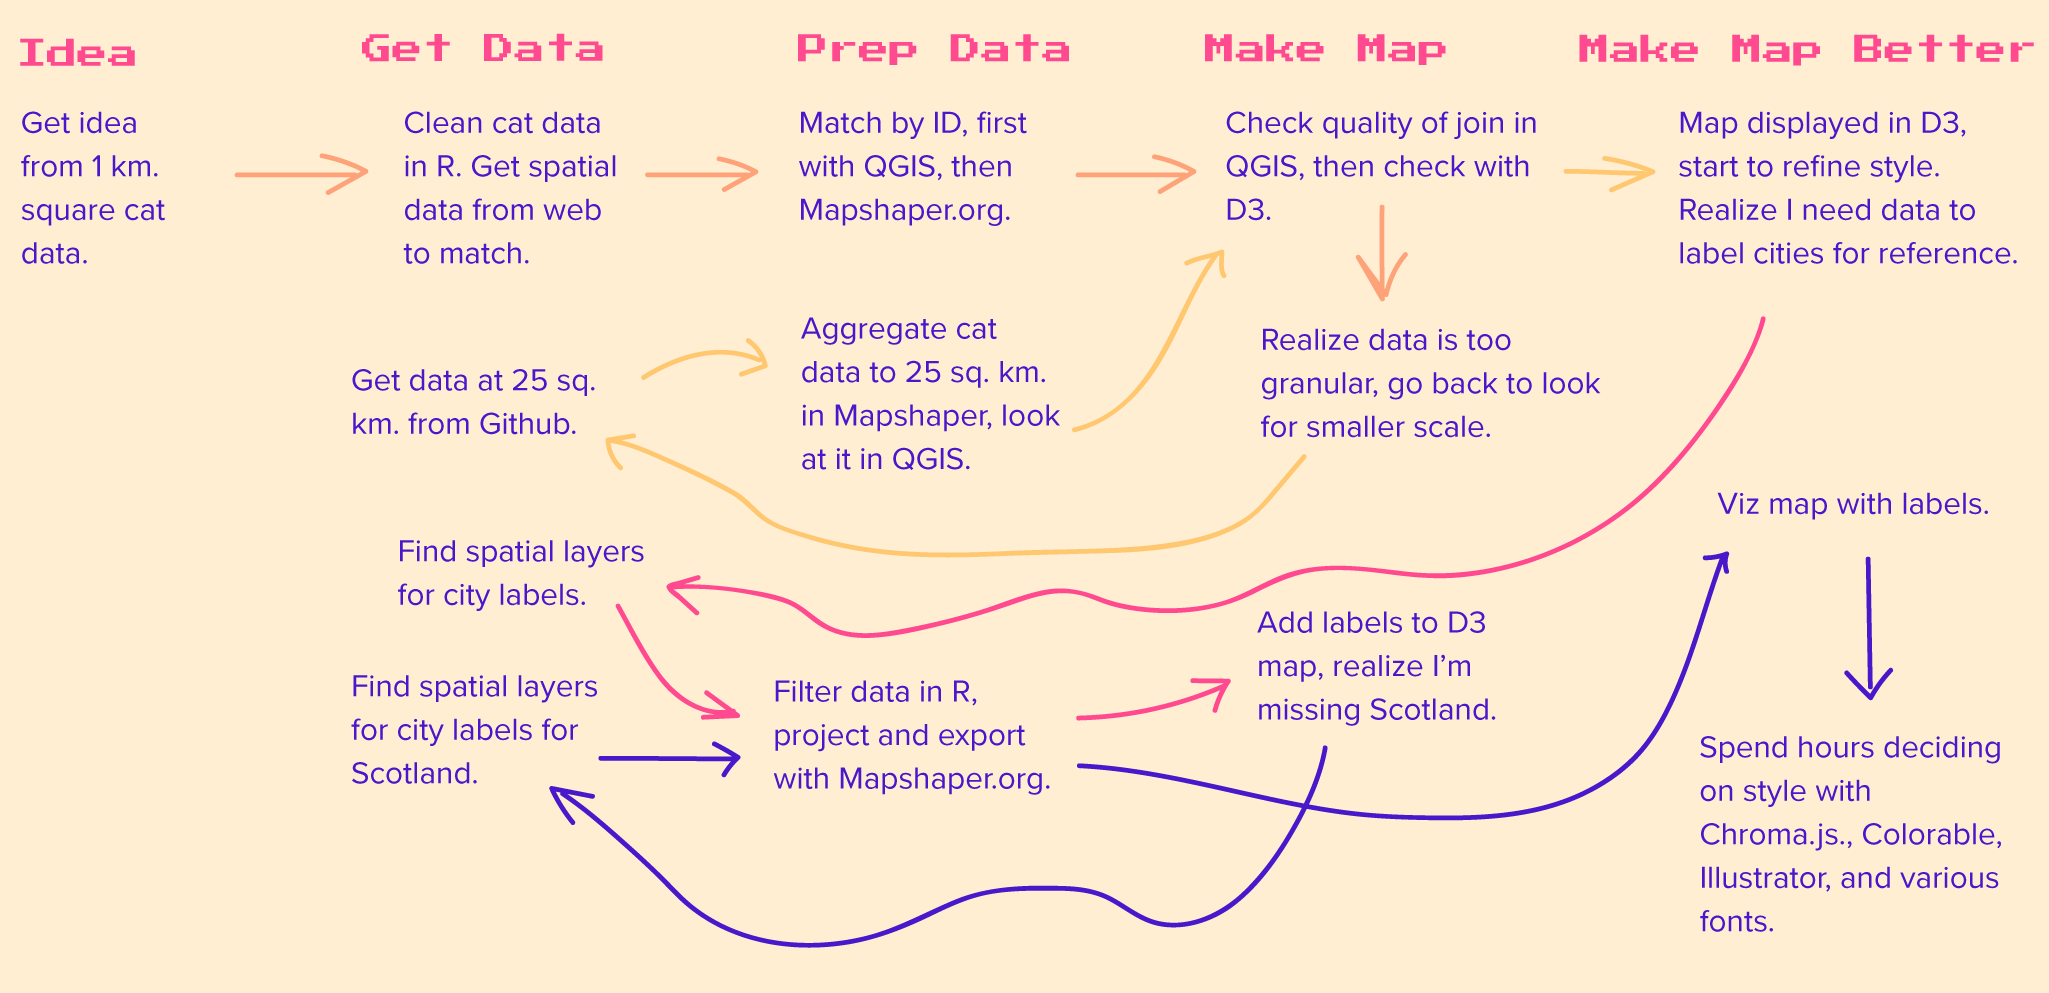
I jumped from tool to tool, from QGIS, to R, to Mapshaper, and then to my D3 app. I relied on R to clean and change tabular data, perform some data joins, and learn about what information I had in a dataset. I used QGIS because it allows you to see your map as a map right away, and makes it easy to work out color scales and projections. Mapshaper, on the other hand, is magic at converting, projecting, joining, and transforming larger datasets that might otherwise freeze up other programs.
我从一个工具跳到另一个工具,从QGIS跳到R,跳到Mapshaper,然后跳到我的D3应用程序。 我依靠R来清理和更改表格数据,执行一些数据联接,并了解我在数据集中拥有的信息。 我之所以使用QGIS,是因为它使您可以立即将地图视为地图,并且可以轻松计算出色标和投影。 另一方面,Mapshaper在转换,投影,联接和转换更大的数据集方面具有魔力,否则这些数据集可能会冻结其他程序。
These are not the only tools I use in making maps and data visualizations, but for this map they were the ones that got me from some simple cat data to simple cat map. Of course, when I was done with it, I tried to make it even more pawesome with a GIF chart, pulling from Cats As A Service — which I have been dying to use in a project.
这些不是我用于制作地图和数据可视化的唯一工具,但对于这张地图,它们是使我从一些简单的猫数据到简单的猫图的工具。 当然,当我完成此工作后,我尝试通过GIF图表使它变得更加令人敬畏 ,这是我一直渴望在项目中使用的“ 作为服务的猫”的 源头 。
Once the map was set, I spent time adding hover and click functionality with D3. The D3 code itself can be reused and reproduced, and I recreated most of it here.
设置地图后,我花了一些时间在D3上添加悬停和单击功能。 D3代码本身可以重复使用和再现,我在这里重新创建了大部分代码。
In the end, I’m only a bit closer to making more reproducible projects, but I like to remind myself that not a single thing I work on is perfect, and not knowing exactly how to make everything end-to-end with one script is not only okay, but can be the necessary limitation that creates the circumstances for something great.
最后,我离制作更具可复制性的项目仅一步之遥,但我想提醒自己,我从事的工作不是一件完美的事情,也不确切地知道如何使用一个脚本来端到端地完成所有工作不仅可以,而且可以成为创造伟大事物环境的必要限制。
Otherwise, the dread of impostor syndrome creeps in and you get stuck doing only the things you know you know, ya know? For now, I’m striving to make mapmaking more transparent and reproducible, while giving myself the space to learn, grow, and experiment with strange little maps of cats.
否则,冒名顶替综合症的恐惧就会蔓延开来,而您只能从事某些事情 你知道吗,你知道吗? 现在,我正在努力使地图制作更加透明和可复制,同时给自己一个学习,成长和尝试奇怪的小猫咪地图的空间。

翻译自: https://medium.com/nightingale/how-i-go-from-zero-to-map-6b3398ea1f07
零基础跳到高精地图


 4478
4478


 被折叠的 条评论
为什么被折叠?
被折叠的 条评论
为什么被折叠?
 到【灌水乐园】发言


