


apache beam
It is fascinating to see how malleable our data is becoming. Nowadays we have tools to convert highly nested and complex log data to simple rows format, tools to store and process petabytes of transaction data, and tools to capture raw data as soon as it gets generated, to process and provide useful insights from it.
令人惊讶的是,我们的数据变得具有可塑性。 如今,我们拥有将高度嵌套和复杂的日志数据转换为简单行格式的工具,用于存储和处理PB事务数据的工具,以及用于在原始数据生成后立即对其进行捕获,处理并提供有用见解的工具。
In this article, I would like to share one such step-by-step process of generating, ingesting, processing, and finally utilizing real-time data from our own virtual online store.
在本文中,我想分享一个循序渐进的过程,从我们自己的虚拟在线商店中生成,提取,处理并最终利用实时数据。
先决条件 (Prerequisite)
Google Cloud Platform account (If you don’t have an account sign up here for a 3-month free trial with $300 credit to use).
Google Cloud Platform帐户(如果您没有帐户,请在此处注册以获得300美元的信用额度的3个月免费试用)。
- Linux OS. Linux操作系统。
- Python 3. Python 3。
建筑 (Architecture)

步骤1:创建发布/订阅主题和订阅者 (Step1: Create Pub/Sub Topic and Subscriber)
Pub/Sub is a messaging service available in the Google Cloud Platform. It can be considered as a managed version of Apache Kafka or Rabbitmq.
发布/订阅是Google Cloud Platform中提供的消息服务。 可以将其视为Apache Kafka或Rabbitmq的托管版本。
A messaging service basically de-couples the system which produces data(virtual store application in our case) from the system which processes the data(Apache beam on Dataflow in our case).
消息传递服务基本上将产生数据的系统(在本例中为虚拟商店应用程序)与处理数据的系统(在本例中为Dataflow上的Apache Beam)分离。
First, we need to create a service account in GCP which will allow us to access Pub/Sub from our application and Apache beam:
首先,我们需要在GCP中创建一个服务帐户,该帐户将允许我们从应用程序和Apache梁访问Pub / Sub:
Login into your GCP console and select the IAM & Admin from the left menu:
登录到您的GCP控制台,然后从左侧菜单中选择IAM&Admin :
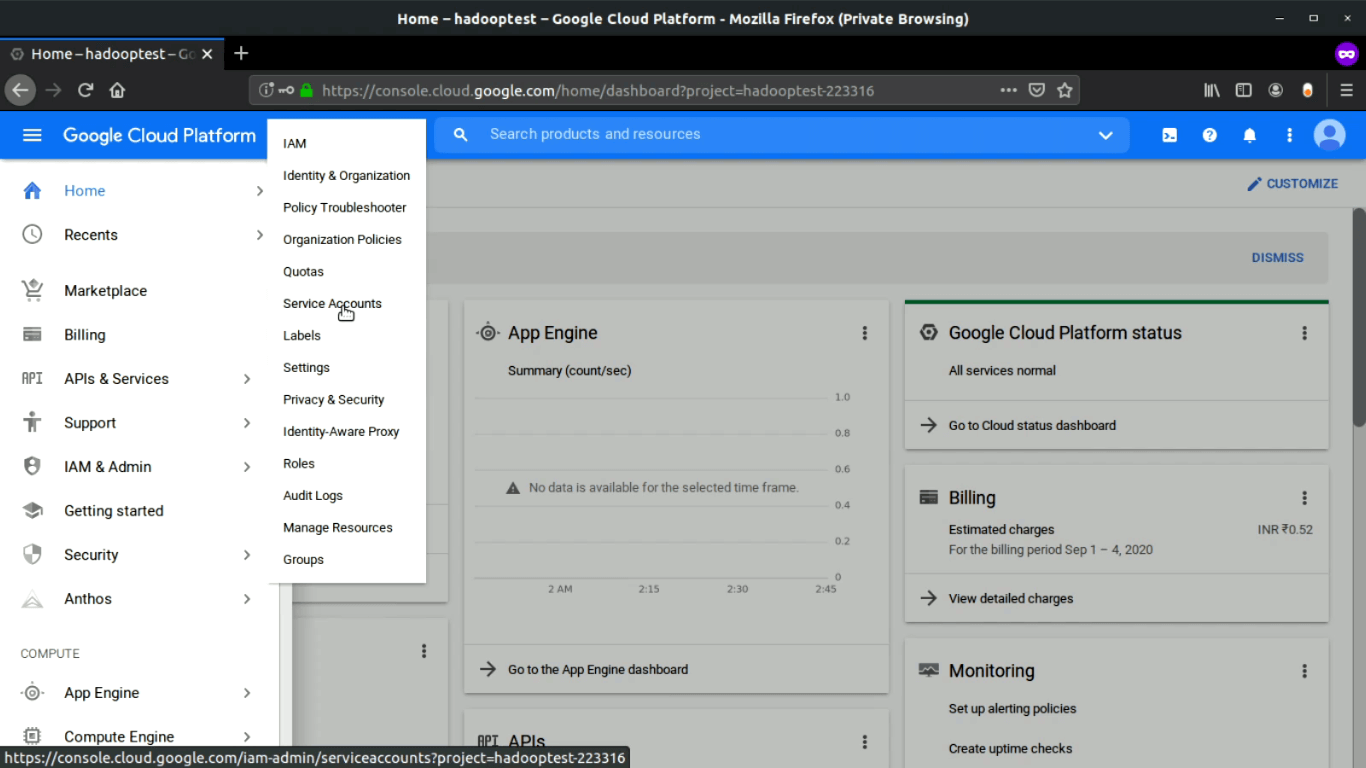
Select the Service Accounts option and create a new service account:
选择“ 服务帐户”选项并创建一个新的服务帐户:

Provide the Pub/Sub Admin role to our service account:
为我们的服务帐户提供发布/订阅管理员角色:

And finally, Create a key and download the private key JSON file for later use:
最后, 创建一个密钥并下载私钥JSON文件以供以后使用:

Next, we will create a topic in Pub/Sub to publish our virtual store data into it and a subscriber to pull data from it using Apache Beam.
接下来,我们将在Pub / Sub中创建一个主题以将虚拟商店数据发布到其中,并创建一个订阅者以使用Apache Beam从中提取数据。
Select Pub/Sub from the left menu of the GCP console.
从GCP控制台的左侧菜单中选择发布/订阅。

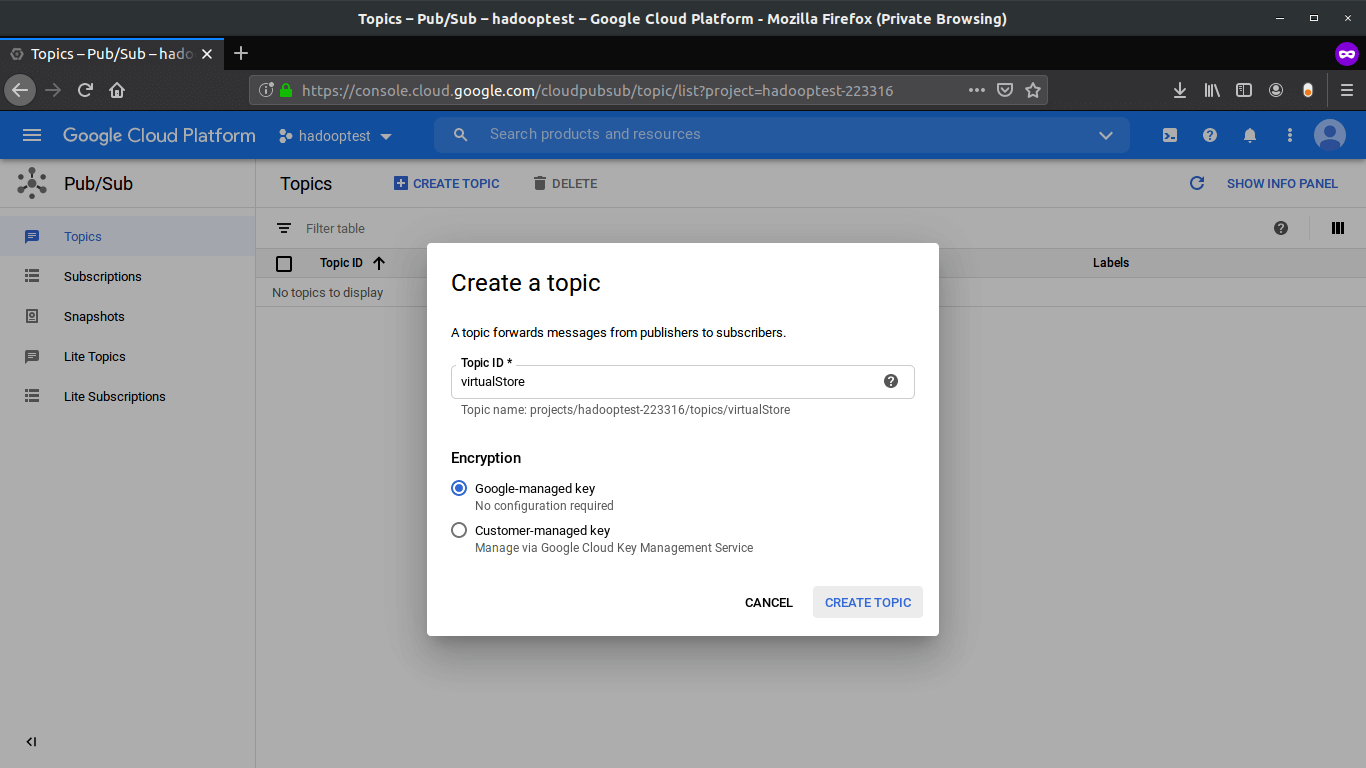
Select Topics from the sub-menu. From the top, select CREATE TOPIC. Enter a suitable name and click CREATE TOPIC.
从子菜单中选择主题 。 在顶部,选择“ 创建主题”。 输入合适的名称,然后单击CREATE TOPIC 。
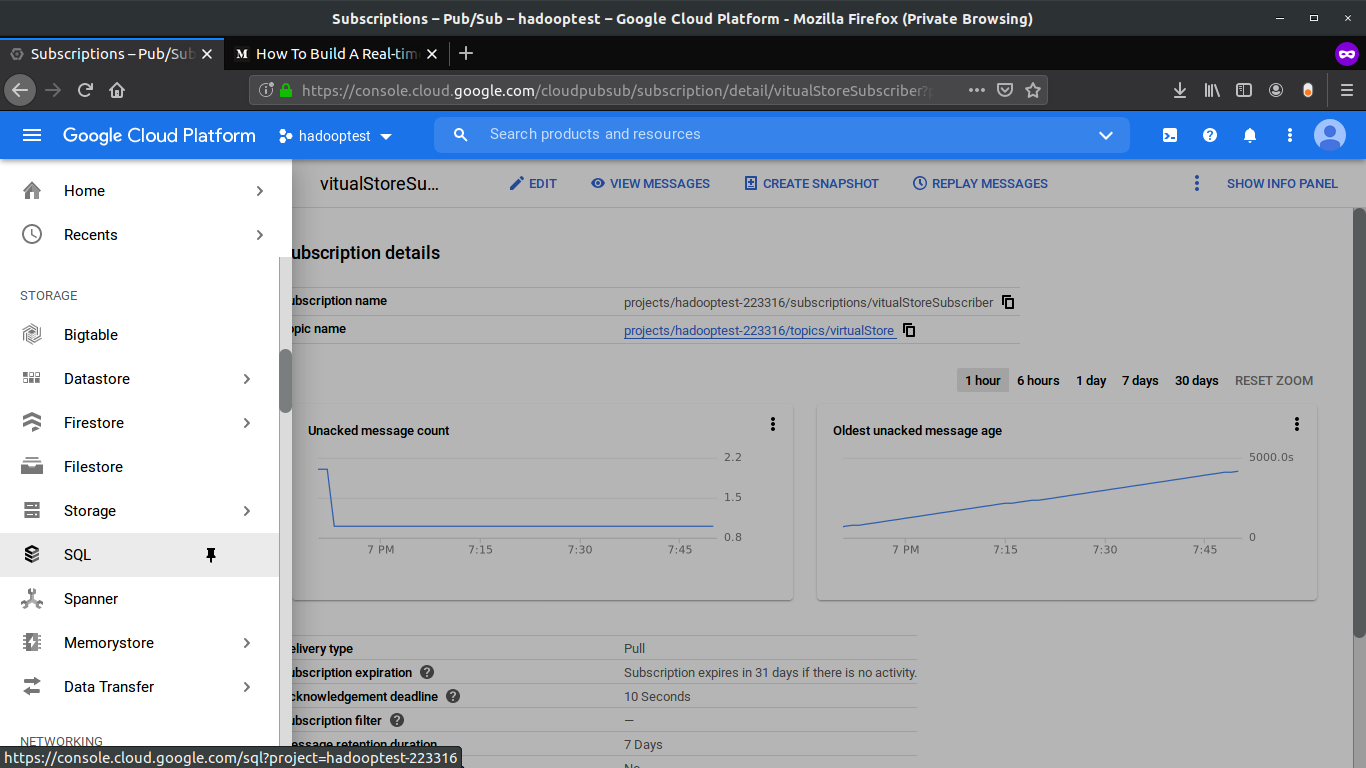
Now, select the Subscriptions option from the left and from the top, select CREATE SUBSCRIPTION. Enter a suitable name, select the topic from the drop-down (we created in the previous step) to which the subscriber will listen for the stream of data. After that click Create at the end, keeping other options as it is.
现在,从左侧选择“ Subscriptions”选项,然后从顶部选择“ CREATE SUBSCRIPTION”。 输入合适的名称,从下拉列表(我们在上一步中创建)中选择主题,订阅者将在该主题上侦听数据流。 之后,单击最后的“ 创建 ”,保持其他选项不变。

步骤2:创建用于生成实时数据的虚拟存储 (Step 2: Create A Virtual Store For Generating Realtime Data)
Now we will create a virtual online store that will push the transaction data into the pub/sub Topic that we have created in previous steps.
现在,我们将创建一个虚拟的在线商店,该商店会将交易数据推送到我们在先前步骤中创建的pub / sub主题。
I have used Dash which is a tool created by Plotly to quickly build a web application using different prebuild UI components like button, text input, etc. A complete tutorial to build a web application is out of this article’s scope since our main focus is to build a realtime pipeline. So you can just download the complete application from the GitHub repo Here.
我已经使用Dash (由Plotly创建的工具)来使用不同的预构建UI组件(例如按钮,文本输入等)快速构建Web应用程序。构建Web应用程序的完整教程超出了本文的范围,因为我们的主要重点是建立实时管道。 因此,您可以从GitHub存储库Here下载完整的应用程序。
The only thing important is the script which publishes our data into the Pub/Sub topic:
唯一重要的是将数据发布到Pub / Sub主题中的脚本:
Let's start our online virtual store, after downloading the project from the Git create a virtual python environment and install all the packages using the requirement .txt file. Now open the folder in the terminal and run app.py file. You will see the below output:
从Git下载项目后,让我们开始在线虚拟商店,创建一个虚拟python环境并使用需求.txt文件安装所有软件包。 现在,在终端中打开文件夹并运行app.py文件。 您将看到以下输出:

Go to your web browser and open localhost:8085. You will see the virtual store home page.
转到您的Web浏览器并打开localhost:8085。 您将看到虚拟商店主页。

Now the fun part lets order a few items and see how our data is getting published into the pub/sub topic and then pulled by the subscriber, that we have created earlier. Add some quantity for each item and click Submit:
现在,有趣的部分允许订购一些项目,并查看我们的数据如何发布到pub / sub主题中,然后由我们先前创建的订阅者提取。 为每个项目添加一些数量,然后点击Submit :

You can see in the terminal some transaction data in JSON format is getting printed every time you place an order. Same JSON data is pushed to the Pub/Sub Topic also. Let’s pull the data from our subscriber, go to the pub/sub dashboard in GCP select the Subscriptions option from the left menu after that click on VIEW MESSAGES from the top and then click Pull to see the published data:
您可以在终端中看到每次下订单时都会打印一些JSON格式的交易数据。 同样的JSON数据也被推送到发布/订阅主题。 让我们从订户中提取数据,转到GCP中的pub / sub仪表板,然后从顶部单击“ 查看消息 ”,然后从左侧菜单中选择“ 订阅”选项,然后单击“ 拉”以查看已发布的数据:

步骤3:创建Apache Beam管道并在数据流上运行 (Step 3: Create Apache Beam Pipeline And Run It On Dataflow)
At this stage, we are getting the data in real-time from our virtual online store to our Pub/Sub subscriber. Now we are going to write our pipeline in Apache Beam to unnest the data and convert it into row like format to store it in MySQL server. And finally, we will run our pipeline using GCP Dataflow runner.
在此阶段,我们正在从虚拟在线商店向发布/订阅用户实时获取数据。 现在,我们将在Apache Beam中编写管道以取消嵌套数据,并将其转换为类似行的格式,以将其存储在MySQL服务器中。 最后,我们将使用GCP Dataflow运行器运行管道。
Before we start writing our data pipeline let’s create a cloud SQL instance in GCP which will be our final destination to store processed data, you can use other cloud SQL services as well, I have written my pipeline for MySQL server.
在开始编写数据管道之前,让我们在GCP中创建一个云SQL实例,这将是我们存储处理后数据的最终目的地,您也可以使用其他云SQL服务,我已经为MySQL服务器编写了管道。
From the GCP console, select the SQL option from the left menu:
在GCP控制台中,从左侧菜单中选择SQL选项:
Select CREATE INSTANCE:
选择创建实例:

Select MySQL:
选择MySQL:

Enter Instance Name and Password for the root user, leave other settings to default and click Create, Now sit back and relax it will take 5–10 min to start the instance:
输入root用户的“ 实例名称”和“ 密码 ”,将其他设置保留为默认设置,然后单击“ 创建”。现在,坐下来放松一下,将需要5-10分钟来启动实例:

After the DB is up and running we need to create a database and table. Connect with your MySQL instance using any SQL client and run below queries:
数据库启动并运行后,我们需要创建一个数据库和表。 使用任何SQL客户端连接MySQL实例并在以下查询中运行:
CREATE DATABASE virtual_store;CREATE TABLE transaction_data(
`id` int(11) NOT NULL AUTO_INCREMENT,
`order_id` VARCHAR(255),
`timestamp` INT(11),
`item_id` VARCHAR(255),
`item_name` VARCHAR(255),
`category_name` VARCHAR(255),
`item_price` FLOAT,
`item_qty` INT,
PRIMARY KEY(`id`)
);
Till now have created our source (Pub/Sub Subscriber ) and Sink (MySQL), now we will create our data pipeline.
到现在为止,我们已经创建了源(Pub / Sub Subscriber)和接收器(MySQL),现在我们将创建数据管道。
Representation of directory for our pipeline is given below, you can clone the complete directory from my GitHub repo here:
下面给出了我们管道的目录表示,您可以在这里从我的GitHub存储库中克隆完整目录:
├── dataflow_pipeline
│   ├── mainPipeline.py
│   ├── pipeline_config.py
│   ├── requirement.txt
│   └── setup.py
Let's start first with the configuration file pipeline_config.py ,this file contains all the configuration like Pub/Sub subscriber details, service account key path, MySQL DB connection details, and table details.
让我们首先从配置文件pipeline_config.py开始,该文件包含所有配置,例如发布/订阅用户详细信息,服务帐户密钥路径,MySQL DB连接详细信息和表详细信息。
Next is the main pipeline file, mainPipeline.py , this is the entry point for different runners (local, Dataflow, etc) for running the pipeline. In this pipeline script, we are reading data from the Pub/Sub, unnesting the data, and storing the final data in a relational database. Later we will visualize it using Google Data studio. Let's look at the code:
接下来是主管道文件mainPipeline.py ,这是用于运行管道的不同运行程序(本地,数据流等)的入口点。 在此管道脚本中,我们从Pub / Sub中读取数据,取消嵌套数据,并将最终数据存储在关系数据库中。 稍后,我们将使用Google Data Studio对其进行可视化。 让我们看一下代码:
First, let's run our pipeline in local:
首先,让我们在本地运行管道:
python mainPipeline.pyYou will see the below output, this means our pipeline is now listening to Pub/Sub for incoming data.
您将看到以下输出,这意味着我们的管道现在正在侦听Pub / Sub中的传入数据。

Let’s place some orders from our virtual online store and see the output of the pipeline.
让我们从虚拟在线商店下订单,然后查看管道的输出。

After clicking submit you will immediately see the output in the pipeline terminal:
单击提交之后,您将立即在管道终端中看到输出:

As you can see our input was nested data in which all the items are nested in a single object, but our pipeline unnested the data into row level.
如您所见,我们的输入是嵌套数据,其中所有项目都嵌套在一个对象中,但是我们的管道将数据取消嵌套到行级别。
Let’s check our database table:
让我们检查一下数据库表:

As expected our single order is transformed into item wise row-level data and inserted in our database on the fly, in real-time.
正如预期的那样,我们将单个订单实时转换为逐项的行级数据,并即时插入到我们的数据库中。
Now we will run our pipeline in GCP Dataflow, for this, we need to run below command:
现在,我们将在GCP Dataflow中运行管道,为此,我们需要运行以下命令:
python mainPipeline.py --runner DataflowRunner \
--project hadooptest-223316 \
--temp_location gs://dataflow-stag-bucket/ \
--requirements_file requirement.txt \
--setup_file ./setup.py
Make sure you create a staging bucket in GCP as I did and provide the link in the above command under “temp_location” option and also create a setup.py in your directory with the below content, this will prevent ModuleNotFoundError.
确保像我一样在GCP中创建一个过渡存储段,并在“ temp_location ”选项下的上述命令中提供链接,并在目录中使用以下内容创建setup.py ,这将防止ModuleNotFoundError 。
Sit back and relax it will take 5–10 min to start the pipeline in GCP dataflow. Now go to the GCP Dataflow dashboard to check if the server started or not.
坐下来放松一下,将需要5到10分钟才能启动GCP数据流中的管道。 现在转到GCP数据流仪表板,检查服务器是否启动。

you can also see the different stages of the pipeline, click on the running job to see the details.
您还可以查看管道的不同阶段,单击正在运行的作业以查看详细信息。

Place some orders from the virtual store and test if the data is coming in DB or not. In my case, it is working as expected. Rows of data in MySQL table is getting inserted in real-time:
从虚拟商店下订单,并测试数据是否来自数据库。 就我而言,它按预期运行。 MySQL表中的数据行正在实时插入:

Note: Closing our local terminal from which we deployed the pipeline in GCP won’t affect the pipeline running in Dataflow on GCP. Make sure to terminate the pipeline from the GCP as well.
注意:关闭在GCP上部署管道的本地终端不会影响在GCP上的Dataflow中运行的管道。 确保也从GCP终止管道。
步骤4:创建Datastudio仪表板以可视化我们的实时数据 (Step 4: Create Datastudio Dashboard For Visualizing Our Realtime Data)
Google Data Studio is a free tool for visualizing data. It enables users to create an interactive and effective reporting dashboard very quickly from different data sources.
Google Data Studio是用于可视化数据的免费工具。 它使用户可以从不同的数据源中快速创建交互式且有效的报告仪表板。
Let's connect our sink (MySQL server) to the Data Studio and create a dashboard on the top of our real-time data.
让我们将接收器(MySQL服务器)连接到Data Studio,并在实时数据的顶部创建一个仪表板。
Go to https://datastudio.google.com. Click on Create and select Data source.
前往https://datastudio.google.com 。 单击创建,然后选择数据源。

Give a name to your source at the top left corner and select Cloud SQL for MYSQL as source (If your MySQL database is not in GCP select only MySQL)
在左上角为源命名,并选择Cloud SQL for MYSQL作为源(如果您MySQL数据库不在GCP中,则仅选择MySQL )

Enter your DB credentials and click Authenticate. After that select CUSTOM QUERY, enter the query and select Connect at the top right corner.
输入您的数据库凭据,然后单击身份验证。 之后,选择CUSTOM QUERY ,输入查询并选择右上角的Connect 。

Data Studio will connect to the cloud SQL instance and show us the schema of our table. Now click on CREATE REPORT at the top right corner:
Data Studio将连接到云SQL实例,并向我们显示表的架构。 现在,单击右上角的CREATE REPORT :

Add charts and graphs as per your requirements. You can learn more about data studio here:
根据您的要求添加图表。 您可以在此处了解有关Data Studio的更多信息:

I have created a basic, 2 chart dashboard which shows Item wise quantity sold and Item wise sales.
我创建了一个基本的2图表仪表板,其中显示了按物料分类的 销售 数量和按物料分类的销售。
My final Dashboard, which gets updated as soon as the orders are getting placed:
我的最终仪表板,在下订单后立即进行更新:

结论 (Conclusion)
In this article, I explained how real-time pipeline works. We have created all the components of a data pipeline, a source application which generates data in real-time, a buffer which ingests the data, an actual pipeline in Google cloud Platform which processes the data, a sink to store the processed data, and finally a dashboard to visualize our final data.
在本文中,我解释了实时管道如何工作。 我们已经创建了数据管道的所有组件,实时生成数据的源应用程序,提取数据的缓冲区,Google Cloud Platform中处理数据的实际管道,用于存储已处理数据的接收器以及最后是一个仪表板,以可视化我们的最终数据。
Please leave your comment about this article below and in case you are facing issues in any of the steps specified above you can reach out to me through Instagram and LinkedIn.
请在下面对本文发表评论,如果您在上面指定的任何步骤中遇到问题,您可以通过Instagram与我联系 和LinkedIn 。
apache beam


 9206
9206

 被折叠的 条评论
为什么被折叠?
被折叠的 条评论
为什么被折叠?
 到【灌水乐园】发言


