


A comprehensive guide to using built-in Pandas functions to clean data prior to analysis
有关使用内置Pandas功能在分析之前清除数据的全面指南
介绍(Introduction)
Over time companies produce and collect a massive amount of data, depending on the company this can come in many different forms such as user-generated content, job applicant data, blog posts, sensor data and payroll transactions. Due to the immense number of source systems that can generate data and the number of people that contribute to data generation we can never guarantee that the data we are receiving is a clean record. These records may be incomplete due to missing attributes, they may have an incorrect spelling for user-entered text fields or they may have an incorrect value such as a date of birth in the future.
随着时间的流逝,公司会产生并收集大量数据,具体取决于公司,这可能以许多不同的形式出现,例如用户生成的内容,求职者数据,博客帖子,传感器数据和薪资交易。 由于可生成数据的源系统数量众多,并且有助于数据生成的人员数量众多,因此我们无法保证接收到的数据是干净的记录。 由于缺少属性,这些记录可能不完整,对于用户输入的文本字段,它们的拼写可能不正确,或者它们的值(例如,将来的出生日期)可能不正确。
As a data scientist, it's important that these data quality issues are recognised early during our exploration phase and cleansed prior to any analysis. By allowing uncleaned data through our analysis tools we run the risk of incorrectly representing companies or users data by delivering poor quality findings based on incorrect data. Today we will be using Python and Pandas to explore a number of built-in functions that can be used to clean a dataset.
作为数据科学家,重要的是在我们的探索阶段尽早发现这些数据质量问题,并在进行任何分析之前将其清除。 通过允许通过我们的分析工具使用未清理的数据,我们冒着基于错误数据提供质量差的结果而错误表示公司或用户数据的风险。 今天,我们将使用Python和Pandas探索许多可用于清理数据集的内置函数。
入门 (Getting Started)
For today's article, we are using PyCharm which is an integrated development environment built for Python. For beginners its an excellent tool to use as it streamlines the creation of virtual environments and the installation of specific Python packages such as Pandas. Using virtual environments allows you to manage your project dependencies without impacting your operating systems default Python installation.
对于今天的文章,我们使用的是PyCharm ,它是为Python构建的集成开发环境。 对于初学者来说,它是一个出色的工具,它简化了虚拟环境的创建和特定Python软件包(如Pandas)的安装。 使用虚拟环境使您可以管理项目依赖性,而不会影响操作系统的默认Python安装。
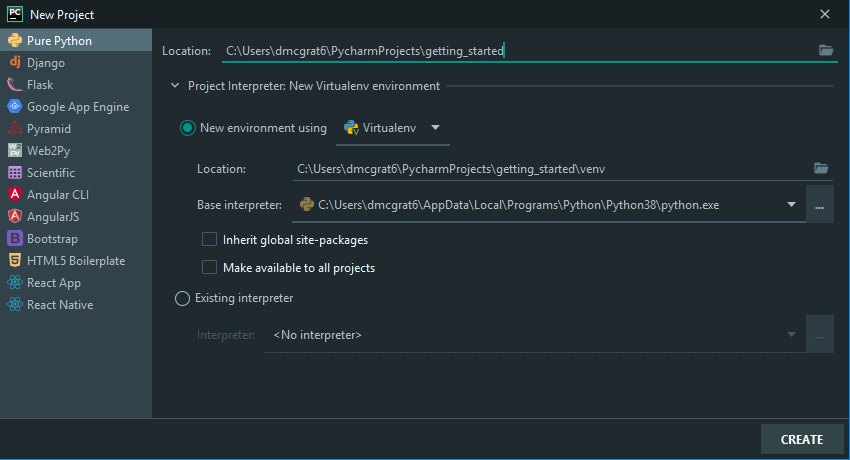
Begin by opening Pycharm and selecting File > New Project from the navigation bar. Here you can name your project using Location and either create a new virtual environment or reference an existing one.
首先打开Pycharm,然后从导航栏中选择“ File > New Project ”。 在这里,您可以使用“ Location来命名项目,并创建一个新的虚拟环境或引用现有的虚拟环境。
To get you started we have created a base Python script below and a CSV file both of which will be referenced throughout the article. Both of these files can be download and saved to your root project directory. The final script can be found here.
为了让您入门,我们在下面创建了一个基本的Python脚本和一个CSV文件,在本文中都将引用这两个文件。 这两个文件都可以下载并保存到您的根项目目录中。 最终的脚本可以在这里找到。
import pandas as pd


if __name__ == '__main__':
    # Override default pandas configuration
    pd.options.display.width = 0
    pd.options.display.max_rows = 10000
    pd.options.display.max_info_columns = 10000


    # Open example data.
    df = pd.read_csv('employee_data.csv')


    # Cast types to save memory.
    df['gender'] = df['gender'].astype('category')
    df['employment_status'] = df['employment_status'].astype('category')
    df['birth_date'] = df['birth_date'].astype('datetime64')


    # Rename columns
    df.rename(columns={'number': 'staff_id'}, inplace=True)


    print(df.info())
    print(df.describe(include='all', datetime_is_numeric=True))
The above script demonstrates a number of DataFrame manipulations after reading a file into memory. On lines 5–7, we are overriding a number of Pandas default configurations which when dealing with larger files can clip the console output when printing. To read the data into memory we use Pandas built-in function read_csv() on line 10 which takes a file name as a parameter. On lines 13–15, we set the data type of three columns which has a number of benefits. Firstly, setting the data type improves performance when processing DataFrame rows by reducing the memory footprint. Secondly, it enriches the descriptive statistics output we get when running Pandas .describe() built-in function. On line 18, we perform a column rename which is commonly practised to convert a generic column name to something more meaningful.
上面的脚本演示了将文件读入内存后的许多DataFrame操作。 在第5-7行,我们覆盖了许多Pandas默认配置,这些默认配置在处理较大文件时可以在打印时剪辑控制台输出。 为了将数据读入内存,我们在第10行使用Pandas内置函数read_csv() ,该函数将文件名作为参数。 在第13-15行,我们设置了三列的数据类型,这有很多好处。 首先,设置数据类型可通过减少内存占用量来提高处理DataFrame行时的性能。 其次,它丰富了我们运行Pandas .describe()内置函数时获得的描述性统计数据输出。 在第18行,我们执行列重命名,通常将其重命名为将通用列名转换为更有意义的名称。
清洁数据框 (Cleaning a DataFrame)
In order to get an understanding of which aspects of the dataset need cleaning we first need to see what data we are dealing with. The best way to do this is by using Pandas built-in functions .info() and .describe().
为了了解数据集的哪些方面需要清理,我们首先需要查看要处理的数据。 最好的方法是使用Pandas内置函数.info()和.describe() 。
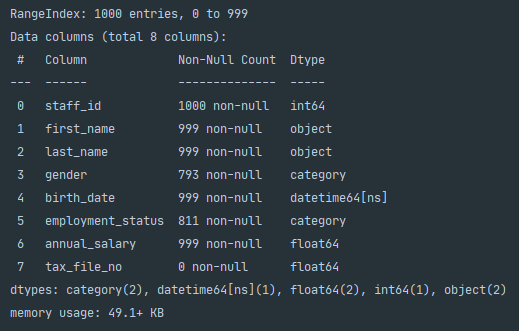
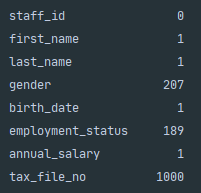
The result of .info() above clearly shows the amount of non-null elements and therefore the number of null elements can be deduced using the RangeIndex from the first line. A quick way of summarising this is calling df.isnull().sum() which sums the number of null elements in each column.
上面的.info()结果清楚地显示了非null元素的数量,因此可以使用第一行的RangeIndex来推断null元素的数量。 总结这一点的一种快速方法是调用df.isnull().sum() ,它对每列中的空元素数量进行求和。
If we need to know the percentage of the null elements as a percentage of the whole dataset then we can do the following.
如果我们需要知道null元素在整个数据集中所占的百分比,则可以执行以下操作。
rows, columns = df.shape
cell_count = rows * columns
number_of_nulls = df.isnull().sum().sum()
percentage_of_missing = (number_of_nulls / cell_count) * 100
print(f'Percentage of missing values: {percentage_of_missing}%')移除列(Removing Columns)
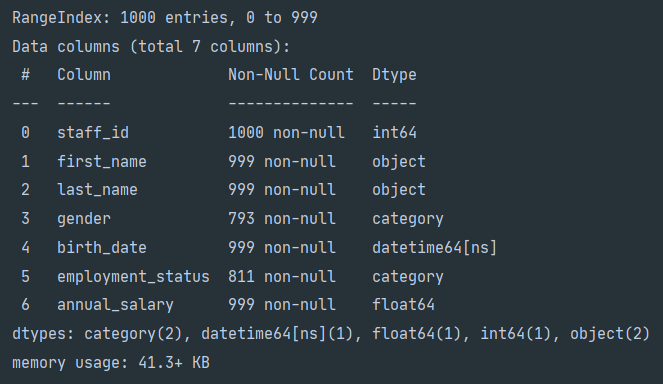
One element that jumps out after calling .info() and .isnull().sum() is the tax_file_no which across 1,000 records has 1,000 null values. The easiest way to remove these types of rows is by using Pandas .dropna(). The .dropna() function takes the form .dropna(axis=0, how='any', thresh=None, subset=None, inplace=False). The axis parameter determines whether the function is applied to rows axis='index' or columns axis='columns'. The how parameter can be how='any' or how='all', which means that the column or row can be dropped if any or all elements have null values. The thresh parameter allows you to set the minimum number of non-null elements within the column or row that are required otherwise it will be dropped. The subset parameter is optional and can receive a list of column names, if the list is empty then the .dropna() function will be applied across all columns or rows. inplace can either be True or False, if True then None will be returned. For our example, we would use df.dropna(axis='columns', how='all', inplace=True). After executing .dropna() and printing out the DataFrame info to the console you will notice that the tax_file_no column is no longer included.
在调用.info()和.isnull().sum()之后跳出的一个元素是tax_file_no ,它在1,000条记录中具有1,000个空值。 删除这些类型的行的最简单方法是使用Pandas .dropna() 。 .dropna()函数采用.dropna(axis=0, how='any', thresh=None, subset=None, inplace=False) 。 axis参数确定是否将函数应用于行axis='index'或列axis='columns' 。 how参数可以是how='any'或how='all' ,这意味着如果任何或所有元素具有空值,则可以删除列或行。 thresh参数允许您设置列或行中所需的最小非空元素的最小数目,否则它将被丢弃。 subset参数是可选的,可以接收列名称列表,如果列表为空,则.dropna()函数将应用于所有列或行。 inplace可以为True或False ,如果为True则将返回None 。 对于我们的示例,我们将使用df.dropna(axis='columns', how='all', inplace=True) 。 在执行.dropna()并将DataFrame信息打印到控制台后,您会注意到tax_file_no列不再包含。
删除行 (Removing Rows)
After checking for completely null columns it’s worth checking to see if there are any rows that do not contain enough usable elements. We can achieve this by making use of .dropna(thresh=2) to remove any rows that have less than two elements.
在检查完完全为空的列之后,值得检查是否有任何行没有包含足够的可用元素。 我们可以通过使用.dropna(thresh=2)删除任何少于两个元素的行来实现这一点。
# Check to see if any rows have less than 2 elements.
under_threshold_removed = df.dropna(axis='index', thresh=2, inplace=False)
under_threshold_rows = df[~df.index.isin(under_threshold_removed.index)]
print(under_threshold_rows)
On line 2, we drop any rows that have less than two elements. Line 3 then returns any rows from the original DataFrame whose index does not exist in under_threshold_removed i.e. dropped rows. It accomplishes this by negating ~ pandas built-in .index.isin() function. In our example, one record is returned that only contains the employee number.
在第2行,我们删除所有少于两个元素的行。 然后,第3行从原始DataFrame返回其索引在under_threshold_removed删除的行)中不存在的under_threshold_removed行。 它通过否定~内置的.index.isin()函数来实现此.index.isin() 。 在我们的示例中,返回一条仅包含员工编号的记录。
填写缺失值 (Filling Missing Values)
In certain circumstances, we may want to retain rows that contain missing values and instead give them a default value when missing. For this example, we are going to map the null values within the gender column to U for Unknown. Pandas provide a built-in function that can achieve this .fillna(value=None, method=None, axis=None, inplace=False, limit=None, downcast=None).
在某些情况下,我们可能希望保留包含缺失值的行,而在缺失时为它们提供默认值。 对于此示例,我们将性别列中的空值映射到U(表示未知)。 熊猫提供了一个内置函数,可以实现此.fillna(value=None, method=None, axis=None, inplace=False, limit=None, downcast=None) 。
Pandas .fillna() is an incredibly powerful function when cleaning data or manipulating a DataFrame. The value parameter can accept a dictionary which will allow you to specify values that will be used on specific columns to fill null values. The benefit of this is when you don’t wish to apply the same null filling value to all null elements within a DataFrame. The method parameter allows you to fill the null values based on other values within a series. You can set the method to ffill which will fill the null with the last valid value that exists in the series. The bfill method option performs a similar function however the filling value is taken from the next valid value that appears in the series. Both the axis and inplace parameters achieve the same outcome as in the .dropna() function discussed above. If you have set the method parameter, you can use the limit parameter to tell .fillna() the maximum number of consecutive null values to check forward/backwards to reach a valid value. If the method parameter is None the limit parameter can be used to set the maximum number of null values in the series that will be filled by the passed values.
Pandas .fillna()是清理数据或操作DataFrame时强大的功能。 value参数可以接受字典,该字典将允许您指定将在特定列上使用的值以填充空值。 这样的好处是,当您不想将相同的null填充值应用于DataFrame中的所有null元素时。 method参数允许您基于系列中的其他值来填充空值。 您可以将方法设置为ffill ,它将使用系列中存在的最后一个有效值填充null。 bfill方法选项执行类似的功能,但是填充值取自系列中出现的下一个有效值。 axis和inplace参数均达到与上述.dropna()函数相同的结果。 如果已设置method参数,则可以使用limit参数告诉.fillna()连续空值的最大数量,以向前/向后检查是否达到有效值。 如果method参数为None ,则可以使用limit参数设置将由传递的值填充的序列中的最大空值数。
As the gender column has a categorical data type, before we can map missing values to U, we first need to create a new category in the series.
由于gender列具有分类数据类型,因此在将缺失值映射到U之前,我们首先需要在系列中创建一个新类别。
# Set a default category for missing genders.
df['gender'].cat.add_categories(new_categories=['U'], inplace=True)
df.fillna(value={'gender': 'U'}, inplace=True)
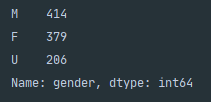
print(df.info())To add a new category we need to isolate the gender column as a series and call .add_categories(). This will allow you to pass in new categories using new_categories=[] which accepts a list. Once your new category has been created you can then use .fillna() and reference the new category. To view the changes that were made you can call df['gender'].value_counts() which will isolate the gender column and provide a value count for each category within the series.
要添加新类别,我们需要将gender列作为一系列隔离,然后调用.add_categories() 。 这将允许您使用接受列表的new_categories=[]传递新类别。 创建新类别后,即可使用.fillna()并引用新类别。 要查看所做的更改,可以调用df['gender'].value_counts() ,它将隔离gender列并为系列中的每个类别提供值计数。
提高可读性 (Improving Readability)
In this context we understand the meaning behind the categories M, F and U however, the stakeholders receiving the data may not understand. To improve the readability of the analysis we can rename the categories to something more meaningful.
在这种情况下,我们理解类别M,F和U的含义,但是,接收数据的利益相关者可能不理解。 为了提高分析的可读性,我们可以将类别重命名为更有意义的名称。
# Renaming DataFrame categories.
df['gender'].cat.rename_categories(new_categories={'M': 'Male', 'F': 'Female', 'U': 'Unknown'},
inplace=True)
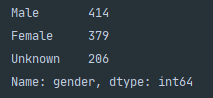
print(df['gender'].value_counts())The above snippet uses the built-in function .rename_categories() which accepts a dictionary that maps the current categories to a new category. The below shows the results of the renaming.
上面的代码片段使用了内置函数.rename_categories() ,该函数接受将当前类别映射到新类别的字典。 下面显示了重命名的结果。
概要 (Summary)
As a data scientist, throughout your career, you are going to encounter incomplete and poor quality datasets. To generate high-quality analysis we need to ensure that we are cleaning data in order to accurately represent the dataset. Pandas offer a diverse range of built-in functions that can be used to clean and manipulate datasets prior to analysis. It can allow you to drop incomplete rows and columns, fill missing values and improve the readability of the dataset through category renaming.
作为数据科学家,在您的整个职业生涯中,您将遇到不完整且质量较差的数据集。 为了生成高质量的分析,我们需要确保正在清理数据以准确表示数据集。 熊猫提供了多种内置函数,可用于在分析之前清理和处理数据集。 它可以让您删除不完整的行和列,填充缺失的值,并通过类别重命名提高数据集的可读性。
Thank you for taking the time to read our story, we hope you found it valuable.
感谢您抽出宝贵的时间阅读我们的故事,希望您发现它有价值。
翻译自: https://medium.com/swlh/data-cleaning-using-python-pandas-f6fadc433535


 250
250


 被折叠的 条评论
为什么被折叠?
被折叠的 条评论
为什么被折叠?
 到【灌水乐园】发言


