


洞悉netfilter
This article is aimed at those wanting to learn how to leverage network traffic capture and analysis tools as part of the digital forensics and incident response (DF/IR) processes. These disciplines involve analyzing the network communications associated with remotely controlled malicious software installed on your organization’s computer systems.
本文针对那些希望学习如何利用网络流量捕获和分析工具作为数字取证和事件响应(DF / IR)流程一部分的用户。 这些学科涉及分析与组织计算机系统上安装的远程控制的恶意软件相关的网络通信。
- Those hoping to become a security operation center (SOC) analyst need to know what is behind the alerts their network monitoring or end-point detection systems produce. 那些希望成为安全运营中心(SOC)分析人员的人需要知道其网络监视或端点检测系统发出的警报背后的原因。
Those seeking to advance in their career doing more detailed DF/IR tasks, including creating new signatures for detection and reporting on new capabilities in malware, need an even deeper understanding of what is contained in network traffic captures (commonly in PCAP format files).
那些希望在职业上取得进展,执行更详细的DF / IR任务(包括创建用于检测和报告恶意软件新功能的新签名)的人,需要对网络流量捕获中的内容(通常为PCAP格式文件)有更深入的了解。
I’ve previously described how to use a command-line tool I wrote called lim to search and access malware sandbox data from the CTU Malware Capture Facility, which archives hundreds of malware sandbox captures, all (as it happens) with PCAP files!
之前,我已经描述了如何使用我写的名为 l im 的命令行工具 从CTU Malware Capture Facility搜索和访问恶意软件沙箱数据,该工具将数百个恶意软件沙箱捕获文件存档(全部发生) 与 PCAP文件!
In this article, I provide a bit of background on using network captures to hunt for malware on your network and understand how it functions, then explain how to leverage a new Open Source platform to process PCAP files using that same command-line tool. I will show you how get it up and running in just a few minutes!
在本文中,我提供了一些背景知识,介绍如何使用网络捕获在网络上搜寻恶意软件并了解其功能,然后说明如何利用新的开源平台使用相同的命令行工具来处理PCAP文件。 我将向您展示如何在短短几分钟内启动并运行它!
这么多的数据包,那么小的可见度! (So many packets, so little visibility!)
If you are new to network forensics — the process of understanding what is happening on compromised networked computers by looking at their communications — it might be hard to know where to start. How do you get PCAP files with malicious communications in them? And how do you interpret what they contain?
如果您不熟悉网络取证,即通过查看受感染的联网计算机的通信来了解其状况的过程,那么可能很难知道从哪里开始。 如何获取带有恶意通信的PCAP文件? 您如何解释其中包含的内容?
As I mentioned in that other article, I was fortunate in my early career to be allowed access to border-level network monitoring capabilities that I could use to investigate computer security incidents, identify compromised hosts, and help the owners clean them up.
就像我在另一篇文章中提到的那样,我很幸运在职业生涯的早期就被允许访问边界级别的网络监视功能,这些功能可用于调查计算机安全事件,识别受感染的主机并帮助所有者进行清理。
I could get as many PCAP files as I needed to analyze, understand, and produce detailed explanations of intrusion activity.
我可以获取分析,理解和提供入侵活动详细说明所需的PCAP文件。
I was only limited by the techniques I could learn, the Open Source tools I could find (and modify, in some cases), and the time available to perform analysis and reporting.
我仅受到可以学习的技术,可以找到(并在某些情况下进行修改)的开源工具以及执行分析和报告的可用时间的限制。
My favorite morning reading was AlephOne’s Bugtraq email list and I put myself to sleep many a night reading the venerated Richard Stevens’ TCP/IP Illustrated three-volume set. (I am not joking. If you want to know how to look into PCAP files, you must at least read Volume 1.)
我最喜欢的早读是AlephOne的Bugtraq电子邮件列表 ,我整夜睡了许多晚,读着尊敬的理查德·史蒂文斯(Richard Stevens)的TCP / IP Illustrated三卷集。 (我不是在开玩笑。如果您想知道如何查看PCAP文件,则必须至少阅读 第1卷)
I quickly learned that running tcpdump on the border of a large network is like trying to drink from a firehose. You either have to focus narrowly on a small number of hosts, or a low volume protocol and port combination, or just capture the start and end of TCP streams, or just capture headers for a short period (or just limit the capture to a reasonable size, like a few hundred megabytes, regardless of what you are capturing).
我很快了解到,在大型网络的边界上运行tcpdump就像尝试从火喉中喝水一样。 您要么只专注于少量的主机,要么只关注少量协议和端口的组合,要么只捕获TCP流的开始和结束,或者只捕获短时间的标头(或者仅将捕获限制在合理范围内)。大小,例如几百兆,无论您捕获的是什么)。
Can you tell I learned that hard way not to fill the hard drive on the system the network engineers relied on to keep the network functioning smoothly and were kind enough to let me use for security operations?
您能告诉我了解到一种很难的方法,即不填充网络工程师所依赖的系统网络中的硬盘驱动器 ,以保持网络平稳运行,并且足够让我用于安全操作吗?
To work and play well with others to keep my access, I had to get creative and script any/all of the above (and then some!)
为了与他人一起工作并与他人保持良好的互动关系,以保持访问权限,我必须发挥创造力,并为上述任何/全部脚本编写脚本(然后编写脚本!)
I wrote a Bash script that wrote Bash scripts (again, I’m not kidding) to spawn cron jobs to schedule packet captures that triggered post-processing the PCAP file with tools like tcpdstat, tcptrace, tcpflow, and a tool I named ipgrepto manipulate and filter IP addresses during incident response and public reporting. It took seconds to start a capture and a while later I got a report with an overview of what was in the capture! Automation of the basic tasks allowed me to focus on analysis and reporting.
我编写了一个Bash脚本,该脚本编写了Bash脚本(再次,我不是在开玩笑)以生成cron作业以计划数据包捕获,从而触发了使用tcpdstat , tcptrace , tcpflow的工具以及我名为ipgrep的工具对PCAP文件进行后处理在事件响应和公共报告过程中操纵和过滤IP地址。 开始捕获花了几秒钟,不久后我得到了一份报告,其中概述了捕获内容! 基本任务的自动化使我能够专注于分析和报告。
I described these tools and how to use them to identify file sharing bots in a talk at CanSecWest CORE ’02 and covered how I used them to expel an intrusion campaign in another Medium article.
在CanSecWest CORE '02上的一次演讲中,我描述了这些工具以及如何使用它们识别文件共享机器人,并在另一篇Medium文章中介绍了如何使用它们来阻止入侵活动。
The lesson here is that you need to know what to look for, and how to efficiently find it, in large volumes of network traffic where most of the traffic is benign.
在这里的教训是,您需要知道在大部分流量是良性的大量网络流量中要寻找的内容以及如何有效地找到它。
Oh, and a toolchain that automates the process!
哦,还有一个使过程自动化的工具链!
Before we get to the toolchain, let me digress for a moment and explain the detection process you will want to learn how to perform using Internet Relay Chat (IRC) XDCC bots as an example.
在进入工具链之前,让我先讨论一下,并说明您将要学习如何使用Internet中继聊天(IRC)XDCC bot作为示例的检测过程。
识别$ BADNESS (Identifying $BADNESS)
XDCC bots were used for wide-spread sharing of copyright content from compromised systems whose large hard drives filled with pirated content on very fast Internet2 networks. The owners of those systems didn’t even know this was happening!
XDCC僵尸程序用于从受感染系统中广泛共享版权内容,这些系统的大型硬盘在非常快的Internet2网络上充满了盗版内容。 这些系统的所有者甚至不知道这种情况正在发生!
The first step in countering them (or many bots or RATs, for that matter) is understanding the basic command and control (C2) styles for botnets.
对抗它们(或许多僵尸或RAT)的第一步是了解僵尸网络的基本命令和控制(C2)样式 。
Commonly used protocols for centralized botnet C2 include the Internet Relay Chat (IRC) protocol (default port 6667/tcp) and HTTP (default port 80/tcp). Spamming botnets use their C2 channel to get addresses and templates for sending spam, then initiating many successful (and possibly even more unsuccessful) Simple Mail Transport Protocol (SMTP) flows. DDoS bots are similar, and their commands are often easy to spot because they precede huge traffic flows to (usually) one or a few destination IP addresses.
集中式僵尸网络C2常用的协议包括Internet中继聊天(IRC)协议(默认端口6667/tcp )和HTTP(默认端口80/tcp )。 垃圾邮件僵尸网络使用其C2通道获取发送垃圾邮件的地址和模板,然后启动许多成功的(甚至可能更不成功的 )简单邮件传输协议(SMTP)流。 DDoS僵尸程序很相似,并且它们的命令通常很容易发现,因为它们先于(通常)一个或几个目标IP地址的巨大流量流。
Next, you leverage what you — and the rest of the security community — know about what to look for in captured network traffic, in this case specifically to identify the XDCC bots’ communications.
接下来,您可以利用自己以及安全社区的其他成员了解要在捕获的网络流量中查找的内容 ,在这种情况下,专门用于标识XDCC僵尸程序的通信。
By selectively capturing short (e.g., 5 minutes at a time, twice per hour) samples of traffic to common IRC ports, filtering out anything that does not match the signature of XDCC bot command and control messages, it was easy for me to find these illegal servers without seeing any private communication.
通过有选择地捕获到常见IRC端口的短暂(例如,一次5分钟,每小时两次)的流量样本,过滤掉与XDCC bot命令和控制消息的签名不匹配的所有内容,我很容易找到这些非法服务器,却看不到任何私人通信。
I called the program I wrote to do the detection and reporting to the security operations email list findoffer (because it was detecting bots offering pirated files to those looking for them). You can see how the regularly structured commands can be identified by signature, parsed, and processed to produce a structured report (similar to a standard “break report”, for those who learned how to program COBOL.)
我调用了编写的程序来进行检测,并向安全操作电子邮件列表findoffer (因为它正在检测自动程序,以向那些正在寻找它们的人提供盗版文件)。 您可以看到如何通过签名来识别,解析和处理常规结构化命令,以生成结构化报告(类似于标准的“中断报告”,对于那些学习如何编程COBOL的人来说)。
# Offer lines are of the form (element numbers on following line):
# :[mF]-XDCC72!~mF@host.site.edu PRIVMSG #WAREZCHAN :Total Offered: 3147.5 MB  Total Transferred: 266.97 GB# Files served lines are of the form:
# :WC-DCC439!~CENTRAL@host.site.edu PRIVMSG #WAREZCHAN :^B#2 ^B  37x [133M] ^BTivoli.Distributed.Monitoring.Classic.Edition.3.7-JUSTiSO
We could then proactively contact the owners of those compromised systems to help them clean their systems up with little effort, usually long before DMCA take-down requests would come in.
然后,我们可以主动与那些受到感染的系统的所有者联系,以帮助他们毫不费力地清理系统,通常是在DMCA删除请求提出之前。
Granted, this is far more basic and simple than the situation today with modular malware that proxies the command and control traffic through a system behind your firewall and network defenses to evade detection. Sure, things were much simpler two decades ago. But examining these early “bleeding edge” case studies — which are still pretty detail-rich and technical — will help you to learn by starting with simpler examples and building up.
诚然,这比当今的模块化恶意软件更加基本和简单,模块化恶意软件代理命令并通过防火墙和网络防御系统逃避检测来控制流量。 当然,二十年前的事情要简单得多。 但是,研究这些早期的“边缘化”案例研究( 仍然具有相当多的细节和技术性)将通过从更简单的示例开始并逐步构建来帮助您学习。
教好响应者...🎼 (Teach, responders well… 🎼)
I published a metric $#%!-ton (a technical term) in my early career as an information security professional. I wanted to help as many others compromised by the same TTPs have access to the information I just discovered and steps I followed so they can better protect, detect, respond, and recover.
在我作为信息安全专业人员的早期职业中,我发布了度量标准的##%!-吨(技术术语)。 我想帮助受相同TTP损害的其他许多人访问我刚刚发现的信息以及我遵循的步骤,以便他们可以更好地保护,检测,响应和恢复。
This included a report on network sniffers, a guide on responding to suspected intrusions following a comprehensive security checklist I assembled, a method for calculating damages from computer security incidents, one of the first detailed guides on nascent disk forensic analysis tools (later turned into the Basic Steps in Forensic Analysis of Unix Systems), many of the first public DDoS tool analyses (trinoo, Tribe Flood Network, stacheldraht, Shaft, and mstream), and I maintained the most comprehensive web page on Distributed Denial of Service Tools.
其中包括一份有关网络嗅探器的报告,一份我编写的综合安全清单后如何应对可疑入侵的指南,一种计算计算机安全事件造成的损害的方法,有关新生磁盘法医分析工具的第一批详细指南之一(后来变成了Unix系统取证分析的基本步骤 ),许多最早的公共DDoS工具分析( trinoo , Tribe洪水网络 , stacheldraht , Shaft和mstream ),并且我维护了有关分布式拒绝服务工具的最全面的网页 。
Most of those publications involved analysis of hard drive contents, reverse engineered malware, and how to analyze network packet captures in PCAP format. I maintained a list of network analysis tools and guides to go with the analyses so others could repeat what I did.
这些出版物大多数涉及硬盘内容分析,反向工程恶意软件以及如何分析 PCAP格式的网络数据包捕获。 我维护了一份网络分析工具和指南以进行分析,以便其他人可以重复我所做的事情。
But there were limits to how much I could share. I couldn’t give out actual network packet captures, or copies of hard drives, for many legal and ethical reasons.
但也有限制多少我可以分享。 由于许多法律和道德原因,我无法给出实际的网络数据包捕获或硬盘驱动器副本。

This was one of the motivators for me to join the Honeynet Project. We published many “challenges” that included bit image copies of honeypot hard drives, packet captures, malware artifacts, etc. for people to analyze. These are still a valuable and frequently used resource. Check them out if you haven’t seen them yet as you will find a lot you can learn from them.
这是我加入Honeynet项目的动力之一。 我们发布了许多“ 挑战 ”,其中包括蜜罐硬盘驱动器的位图副本,数据包捕获,恶意软件工件等,供人们分析。 这些仍然是宝贵且经常使用的资源。 如果尚未看到它们,请查看它们,因为您会发现很多可以从中学习的东西。
使用哪个“工具”? (Which “tool” to use?)
The next logical question you might ask is, “Which tool should I use to look at PCAP files?”
您可能要问的下一个逻辑问题是:“我应该使用哪个工具查看PCAP文件?”
Of course, you should use the right tool for the job! There isn’t just one tool. In fact, there are many different tools you can use and they each do slightly different things. Selecting which one (or which ones) depends on first knowing what you want to accomplish and how much effort you want to spend in the process.
当然,您应该使用正确的工具来完成工作! 不仅有一种工具。 实际上,您可以使用许多不同的工具,并且每种工具的功能略有不同。 选择哪一个(或哪些 )取决于第一个知道你想要什么,完成了多少努力想要在这个过程中花费。
Do you want to get high-level statistics about protocols, ports, flow lengths in bytes, or time duration? Or do you want to extract specific flows into files you can process, maybe carving out the files that were transferred in the flow?
是否要获取有关协议,端口,以字节为单位的流长度或持续时间的高级统计信息? 还是要将特定流提取到可以处理的文件中,也许是要切出在流中传输的文件 ?
If you ask <SOME_SEARCH_ENGINE> “which tool to use for looking at pcap files,” high on the list (barring offensive $EO tactics) will be a reference to Wireshark. Lots of people will say, “It’s so easy to use Wireshark to see what is in the packets on the network!”
如果您问<SOME_SEARCH_ENGINE> “ 使用哪种工具查看pcap文件 ”,则该列表中的高位(除非采取进攻性的$ EO策略)将是Wireshark的参考。 很多人会说:“使用Wireshark来查看网络数据包中的内容非常容易 !”
OK. Don’t get me wrong. Wireshark has its place, and yes, it is easy to install it, run it, open a PCAP file — or illegally capture all the traffic on your local coffee shop’s wireless network… what, you haven’t heard about the Wiretap Act? — and see packets. Lots of packets! (Too many packets?)
好。 不要误会我的意思。 Wireshark占有一席之地,是的,它很容易安装,运行,打开PCAP文件-或非法捕获本地咖啡店无线网络上的所有流量……什么,您还没有听说过《 Wiretap Act》吗? —并查看数据包。 很多包! (包太多?)
What if the packet capture you want to analyze has a million flows in it, all interspersed and spread over days, with each flow consisting of thousands of packets using any of dozens of IP protocols?
如果您要分析的数据包捕获中有一百万个流,这些数据流散布并散布在几天中,并且每个流都包含使用数十种IP协议中的数千个数据包组成的流量?
Think about it this way. In the photo of the two young girls above, what if the lights in the room were off and the only illumination was from a small LED tactical flashlight. All they could see would be parts of a few strings at a time, whichever ones happened to be right in front of where they were standing.
这样想吧。 在上面的两个年轻女孩的照片中,如果房间里的灯熄灭了,唯一的照明来自一个小型LED战术手电筒。 他们一次只能看到几根弦的一部分,而恰好恰好在他们站立的地方前面。
They can’t see the larger picture — more importantly, the larger structure of vertices and edges — without turning on all of the lights in the room and standing back a bit (like the vantage point of the photographer).
他们看不到更大的图片,更重要的是,没有更大的顶点和边缘结构,而又不打开房间中的所有灯光并稍微后退(像摄影师的制高点)。
The larger picture (literally, like that in this graph) is where we’d like to eventually get. (Spoiler alert: We won’t get there in this article, but this is the kind of visualization you will want to produce to communicate findings from your analysis.)
更大的图片(从字面上看,就像这张图中的图片)是我们最终想要得到的。 (剧透警报:本文中不会介绍,但这是您希望产生的可视化形式,用于传达您的分析结果。)

It may be easy to see what is in a small PCAP file with Wireshark, but unless you are a real power user, it isn’t so great at telling you what is happening with millions of packets.
使用Wireshark可以很容易地看到一个小的PCAP文件中的内容,但是除非您是真正的超级用户,否则告诉您数百万个数据包发生了什么并不是很好。

Again, don’t get me wrong! An expert who knows deeply how to dig into a PCAP file to find badness in an instinctual way can quickly (as _Veronica_ demonstrates very well in her thread) leverage Wireshark’s advanced capabilities to find badness in a PCAP file. Mat Lyons applies this concept of fundamental understanding and tool selection in the broader DF/IR space in the Job Series: Incident Response Consulting episode (at 00:52:16) of the Detections Podcast.
同样, 不要误会我的意思 ! 一位非常了解如何以本能的方式挖掘PCAP文件以查找缺陷的专家可以快速地使用_Veronica_在其线程中很好地演示_来利用Wireshark的高级功能在PCAP文件中查找缺陷。 Mat Lyons在检测播客的“ 工作系列:事件响应咨询”情节(00:52:16)中,在更广泛的DF / IR空间中应用了这种基本理解和工具选择的概念。
If you are still figuring out packet-level network forensic analysis, or want to automate the process, that is were higher-level statistical summaries, machine learning analysis and tagging of flows of interest, and intrusion prevention system alerts and signature matches come in. While it is possible, it is not easy to script an interactive tool.
如果您仍在寻找数据包级别的网络取证分析,或希望使流程自动化,那就是更高级别的统计摘要,机器学习分析和关注流的标记以及入侵防御系统警报和签名匹配。尽管有可能,但编写交互式工具的脚本并不容易。
Of course, you may point out that Wireshark comes with the tshark command-line app, which automates the generation of some higher-level statistics.
当然,您可能会指出Wireshark附带了tshark命令行应用程序,该应用程序可以自动生成一些更高级别的统计信息。
You will still be left with the task of preparing a system where you can process the PCAP files by installing the tools like those described. Luckily, someone already did that!
您仍然需要准备系统的任务,在该系统中,您可以通过安装上述工具来处理PCAP文件。 幸运的是,已经有人这样做了!
进入PacketCafé(但请戴上口罩,好吗?😷) (Enter the Packet Café (but please wear your mask, ok? 😷))
On May 1, 2020, amid a global pandemic, In-Q-Tel Labs released an Open Source packet analysis platform called Packet Café.
2020年5月1日,在全球大流行中,In-Q-Tel Labs发布了一个名为PacketCafé的开源数据包分析平台。
Packet Café is an analysis platform that pipelines data through a configurable suite of open source tools to better visualize and dissect PCAP data with an eye toward more intuitive analysis of network traffic data. Packet Café accomplishes this in two ways. First, the PCAP is run through a rigorous analysis pipeline using industry standard tools such as Snort and Mercury, with the raw output being made available to the user for any style of analysis they want to perform. Next, the data is used to generate a dashboard view to allow for visual exploration of the supplied data. Currently, the supplied visualizations focus on answering questions regarding the distribution of IP addresses and ports communicating in an arbitrary PCAP file. We also are exploring ways to add further visualizations and refine our dashboarding capability. — https://www.cyberreboot.org/projects/packet-cafe/
PacketCafé是一个分析平台,可通过一组可配置的开源工具将数据流水线化,从而更好地可视化和剖析PCAP数据,并着眼于更直观的网络流量数据分析。 PacketCafé通过两种方式完成此任务。 首先,使用行业标准工具(如Snort和Mercury)通过严格的分析管道运行PCAP,并将原始输出提供给用户,供用户用于他们想要执行的任何样式的分析。 接下来,该数据用于生成仪表板视图,以便对提供的数据进行可视化浏览。 当前,提供的可视化工具专注于回答有关在任意PCAP文件中通信的IP地址和端口的分布的问题。 我们还正在探索增加可视化和完善仪表板功能的方法。 -https://www.cyberreboot.org/projects/packet-cafe/
The analysis pipeline is illustrated in this diagram:
下图说明了分析管道:
In-Q-Tel Labs’ article Introducing Packet Café mentions some of the difficulties in producing a public corpus of malicious sandbox captures.
In-Q-Tel Labs的文章介绍PacketCafé提到了产生恶意沙箱捕获的公共语料库的一些困难。
The Department of Homeland Security long supported a more closed, vetted-access, catalog of data for computer security research purposes with the Impact Cyber Trust (formerly PREDICT) project.
国土安全部长期以来通过Impact Cyber Trust (以前称为PREDICT)项目为计算机安全研究目的提供了更封闭,经过审查的数据目录。
I described another (publicly available!) source of unredacted files and a tool I wrote to search and download them called lim in “Diving into sandbox-captured malware data.” We can leverage that data to feed into Packet Café.
我在“ 深入沙盒捕获的恶意软件数据 ”中描述了另一个未公开文件的来源(公开可用!)和我编写的用于搜索和下载它们的工具,称为lim 。 ”我们可以利用这些数据将其送入PacketCafé。
The one thing that Packet Café didn’t have was a CLI. So I wrote one!
PacketCafé没有的一件事就是CLI。 所以我写了一个!
入门 (Getting started)
IQTLabs describes the steps for deploying Packet Café on a Mac/Darwin system or a Linux server.
IQTLabs描述了在Mac / Darwin系统或Linux服务器上部署 PacketCafé的步骤 。
One of my primary development platforms right now is a Surface Pro running Ubuntu 18.04 on WSL2 with the Docker Desktop WSL2 Backend. VSCode works great on all three platforms and the only big limitation with that system vs. my Macbook Pro is the ability for lim to directly open web pages in a browser. (I believe this limitation is about to disappear, but if you need the capability, you can install an X Window System server on Windows 10 and get Ubuntu GUI apps that way; just be sure you do this securely!)
我目前的主要开发平台之一是Surface Pro,该平台在Docker Desktop WSL2 Backend上在WSL2上运行Ubuntu 18.04。 VSCode在所有三个平台上都能很好地工作,该系统与Macbook Pro相比,唯一的最大限制是lim能够在浏览器中直接打开网页。 (我相信这种限制即将消失 ,但是如果您需要此功能,则可以在Windows 10上安装X Window System服务器并以这种方式获取Ubuntu GUI应用程序;只需确保安全地执行此操作即可!)
So while IQTLabs’ web page doesn’t mention it, you can also use a Windows 10 system running Docker for Windows and Windows Subsystem for Linux 2 (WSL2).
因此,尽管IQTLabs的网页没有提及它,但是您也可以使用运行Docker Windows版和Windows Subsystem Linux 2(WSL2)的Windows 10系统。
You must ensure you have the prerequisites they list, but (as of version 20.8.6) there is an easier way to get Packet Café up and running, using lim itself!
您必须确保具有列出的先决条件,但是(从版本20.8.6开始)使用lim本身可以更轻松地启动和运行PacketCafé!
First, follow the steps for installing the lim-cli package from PyPI. It works on all of the same systems on which Packet Café will run. The easiest, quickest, and safest method is probably using pipx (as seen in this asciinema asciicast). If you want to get into development, you will want to use a Python virtual environment (something like Miniconda).
首先,按照步骤从PyPI 安装 lim-cli 软件包 。 它可以在运行PacketCafé的所有相同系统上运行。 最简单,最快捷和最安全的方法可能是使用pipx (如本《 Asciinema asciicast》所示)。 如果要开始开发,您将需要使用Python虚拟环境(类似于Miniconda )。
Once you have the prerequisites installed and running, you should be able to run lim cafe subcommands (start with lim help or lim about --help).
一旦安装并运行了先决条件,就应该能够运行lim cafe子命令(以lim help或lim about --help开头)。
Now all you need to do is run lim cafe containers build.
现在您需要做的就是运行lim cafe containers build 。
This will clone the iqtlabs/packet_cafe repository and run the docker-compose command to build and pull all the containers and start them.
这将克隆iqtlabs/packet_cafe存储库,并运行iqtlabs/packet_cafe docker-compose命令来构建和提取所有容器并启动它们。
It’s that simple!
就这么简单!
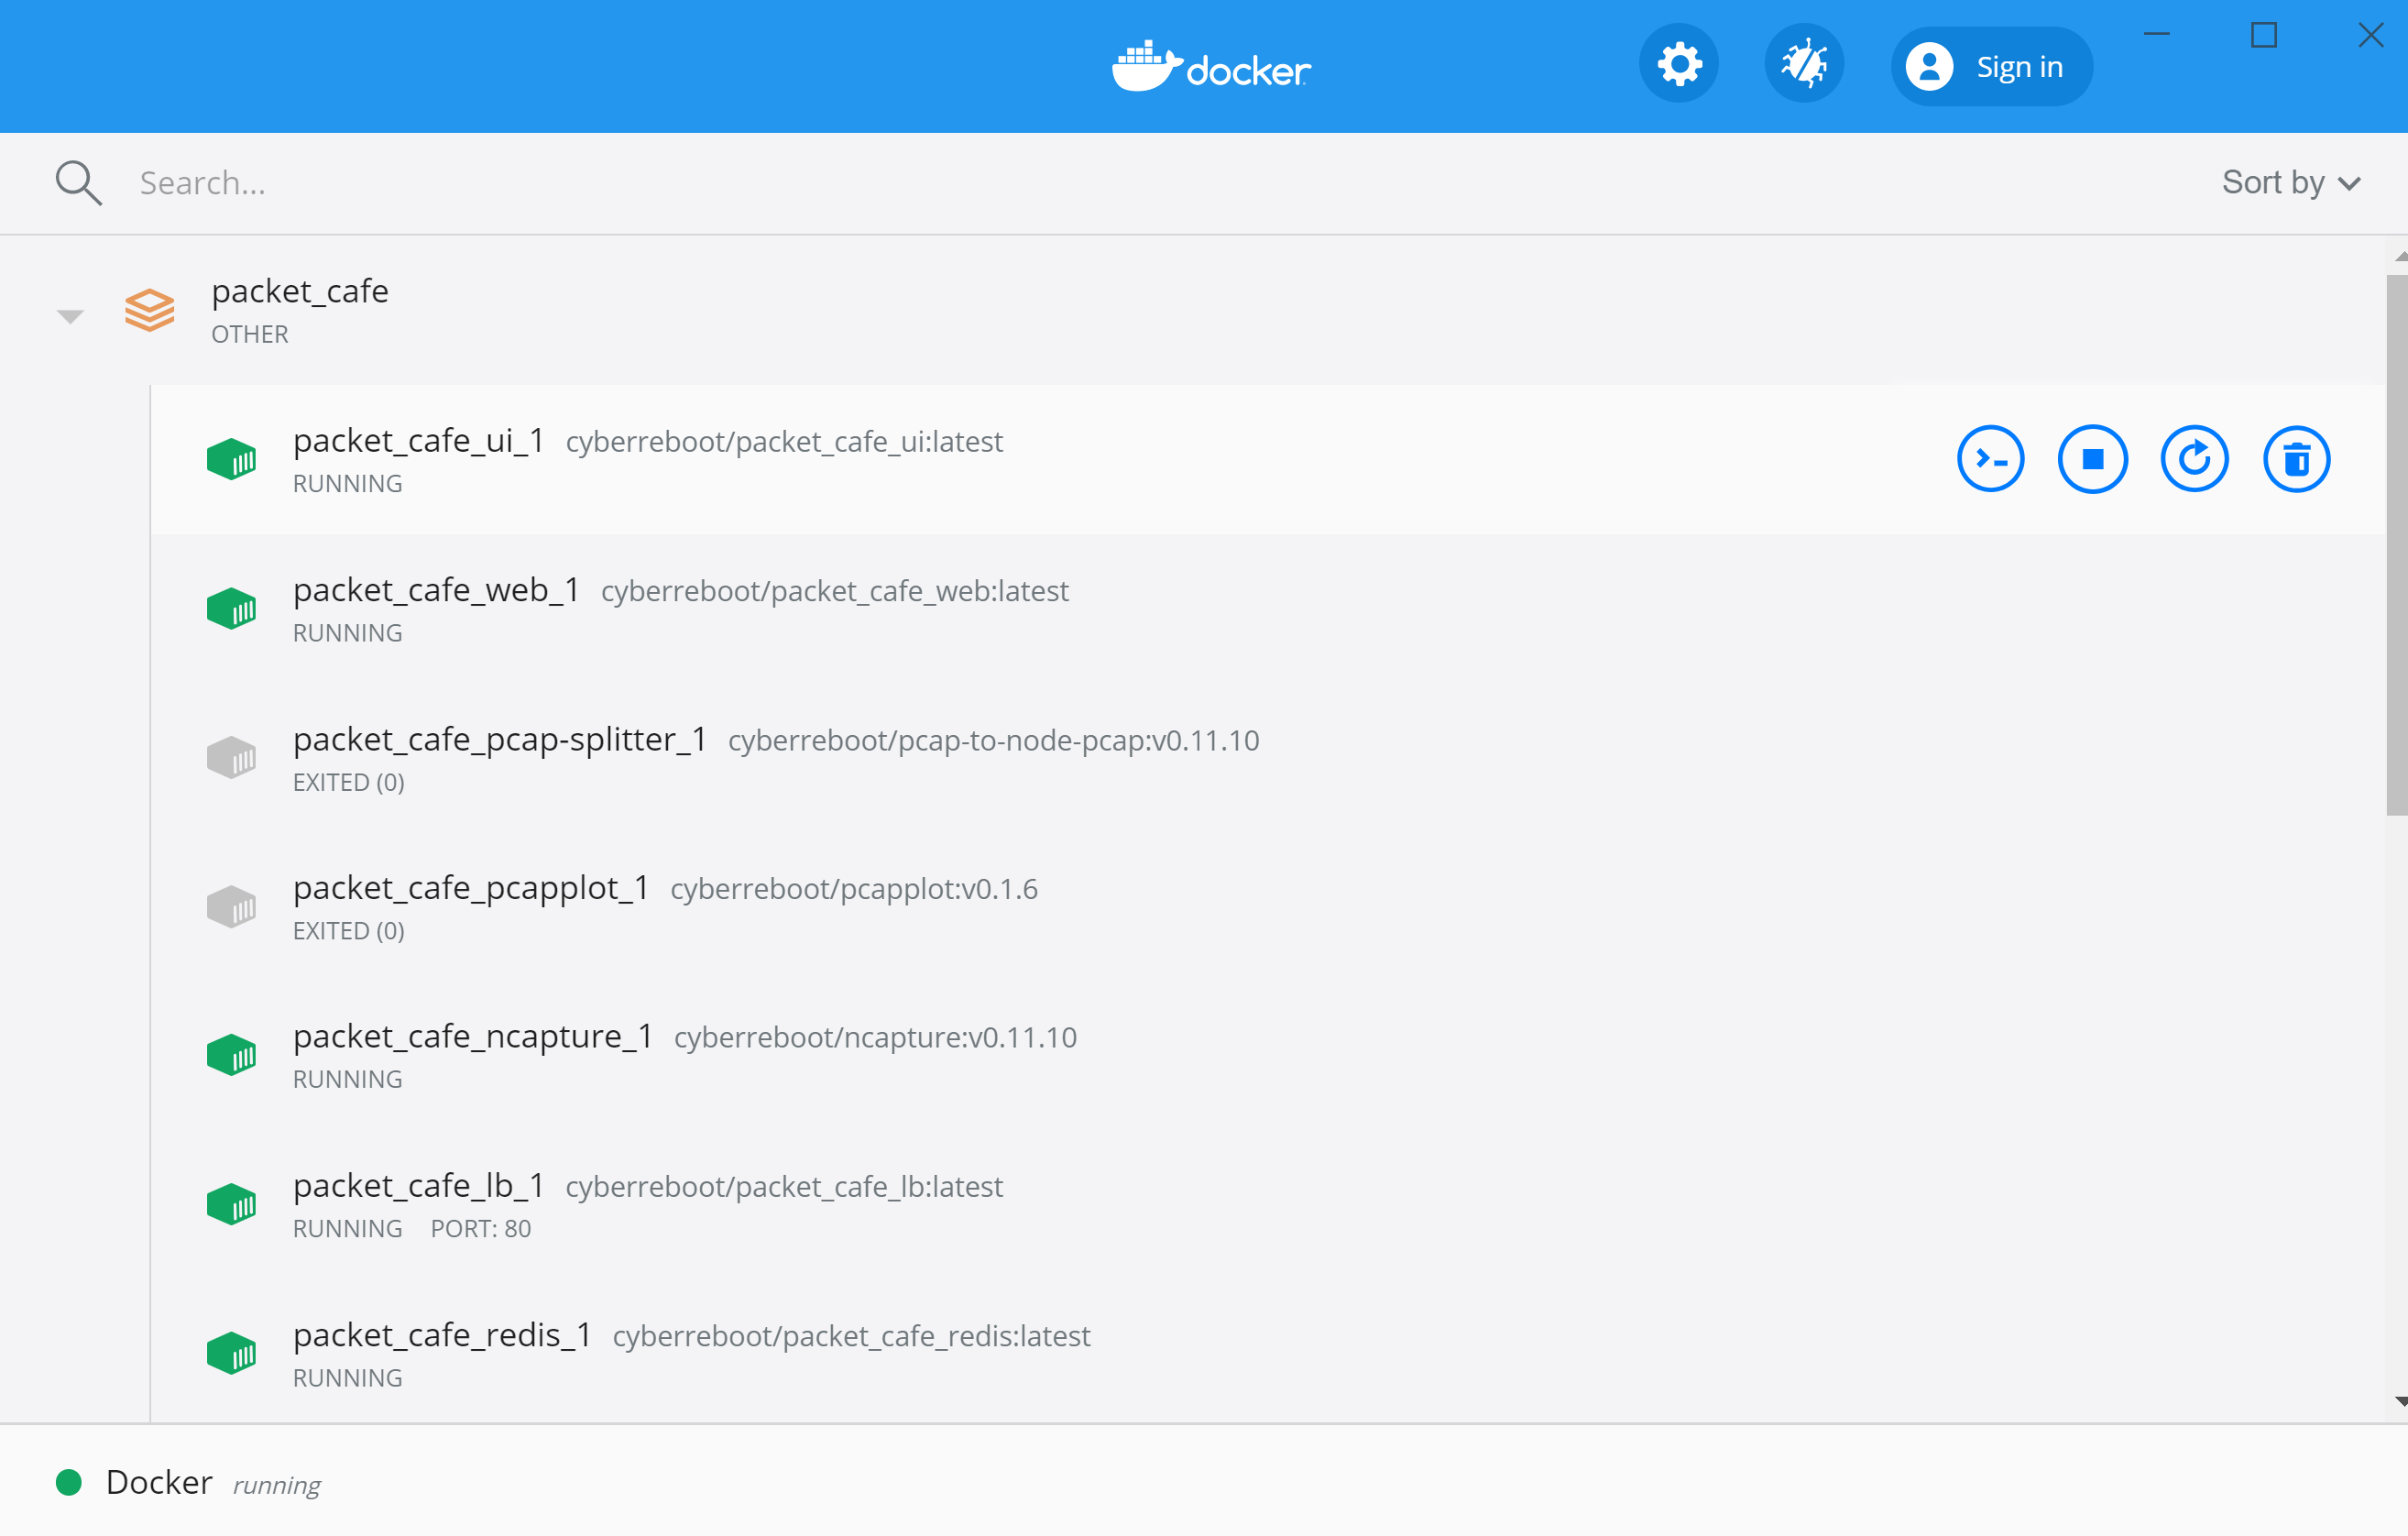
Once the Docker containers are running you will see them in the Docker Dashboard.
Docker容器运行后,您将在Docker Dashboard中看到它们。
You can start the web UI with lim cafe ui. You bring the containers up and then the UI in one command line like this:
您可以使用lim cafe ui来启动Web UI。 您先打开容器,然后在一个命令行中显示UI,如下所示:
$ lim cafe containers build && lim cafe ui
$ lim cafe containers build && lim cafe ui

From the web UI, you can do everything documented on the Packet Café web site (which you can conveniently access from the About dropdown menu). More new UI features will be coming soon.
在Web UI中,您可以执行PacketCafé网站上记录的所有内容(可以从About下拉菜单中方便地访问它)。 更多新的UI功能即将推出。
As a convenience, you can also bring up the Packet Café documentation web page with lim cafe about. You might visit this site first, to learn more about Packet Café and its web UI.
为方便起见,您还可以打开lim cafe about. PacketCafé文档网页lim cafe about. 您可能会首先访问此站点,以了解有关PacketCafé及其Web UI的更多信息。

NOTE: When you are going back and forth between the UI and lim, you may notice the Packet Café UI does not, at this time, update itself when a file is uploaded via the API as we will do with lim in a moment. (This has been reported and should be fixed soon.)
注意:当您在UI和 lim 之间来回切换时 ,您可能会注意到PacketCaféUI在当前通过API上传文件时并没有像在 lim 中 那样进行自我更新 。 (已报告此问题,应尽快解决。)
I’ll leave exploring the UI as “an exercise for the reader.” The rest of this article focuses on using the lim CLI.
我将把UI作为“读者的练习”来探讨。 本文的其余部分着重于使用lim CLI。
I started to add the cafe subcommands to lim within days of the initial Packet Café release in May. (Did I mention I live in the first state with a confirmed COVID-19 case, and the second state in the nation to have a “stay at home” order for COVID-19?)
在五月份的最初PacketCafé发布后的几天内,我开始将cafe子命令添加到lim中。 (我是否提到我居住在第一例确诊COVID-19的州,而第二个州则拥有COVID-19的“待在家里”命令?)
It didn’t take too long to get 100% coverage of the API endpoints, but it has taken a little while longer to polish things up a bit and document them. The silver lining is that there is a good deal of internal documentation you can get with help and or --help from the CLI itself. Commands mostly mirror the names of the API endpoints (which are provided in the help output for reference).
不需要很长时间就能获得100%的API端点覆盖率,但是花了一点时间来完善和记录它们 。 一线希望是,可以从CLI本身获得大量内部文档,您可以从中获得help和/或--help 。 命令大多镜像API端点的名称(帮助输出中提供了这些端点以供参考)。

Before we start exercising Packet Café from the command line, let’s double-check to ensure the Docker containers are running.
在从命令行开始使用PacketCafé之前,让我们仔细检查以确保Docker容器正在运行。

(Note: These screenshots were created before IQTLabs rebranded themselves, so the name cyberreboot shows up here, while the current container names will be in the iqtlabs namespace.)
(注意:这些屏幕快照是在IQTLabs重新命名之前创建的,因此名称cyberreboot在此处显示,而当前容器名称将在iqtlabs命名空间中。)
This is a lot cleaner than the docker ps output, and since it focuses on just the Packet Café containers, you can use it in a script to fail out if the UI containers are not running.
这比docker ps输出要干净得多,并且由于它仅关注PacketCafé容器,因此如果UI容器未运行,则可以在脚本中使用它来进行故障转移。
与PacketCafé互动 (Interacting with Packet Café)
We’ll need some PCAP data to feed it into Packet Café. Let’s get the same file from the CTU Malware Capture Facility that is used by the lim-cli BATS runtime tests. (Take a look at those if want to work with the lim-cli source code, especially the runtime integration tests.)
我们需要一些PCAP数据才能将其输入到PacketCafé中。 让我们从lim-cli BATS运行时测试使用的CTU恶意软件捕获工具中获取相同的文件。 (看看那些想使用lim-cli源代码的人,尤其是运行时集成测试。)

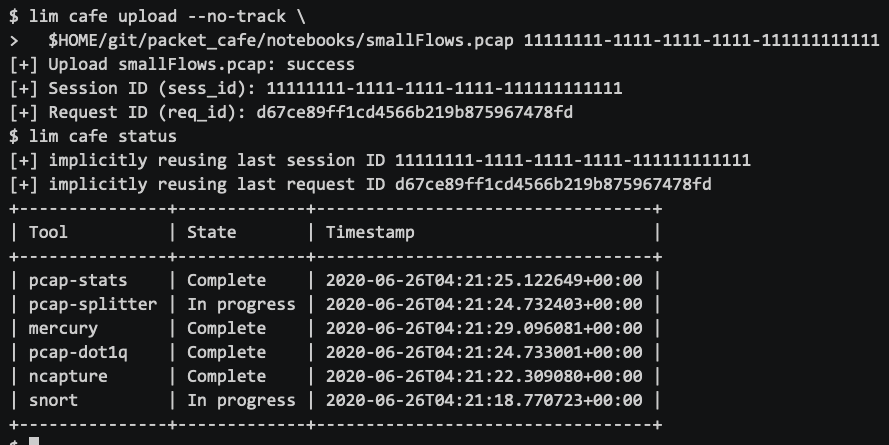
Note that as we upload a PCAP filelim defaults to tracking the progress of the workers as they are processing the file, similar to the way the Packet Café UI does. Some return in just seconds, while others can take quite a while (depending on the size of the PCAP file and number of flows). We’ll also add the --elapsed flag here to include per-worker and total elapsed times.
请注意,当我们上载PCAP文件时, lim默认情况下会跟踪工作人员在处理文件时的进度,这与PacketCaféUI的方法类似。 有些会在几秒钟内返回,而另一些会花费一些时间(取决于PCAP文件的大小和流的数量)。 我们还将在此处添加--elapsed标志,以包括每个工作人员和总经过时间。

You can also get the worker status information in tabular form, which we’ll see in a minute.
您还可以表格形式获取工作人员状态信息,我们将在稍后显示。
If you don’t want to wait for the workers to complete when using lim cafe upload, you can disable tracking workers and just get status interactively with the lim cafe status command. You also have the option of providing your own session ID (in case you want to ensure it tracks with other parts of your larger DF/IR toolchain).
如果您不希望在使用lim cafe upload时等待工作人员完成,则可以禁用跟踪工作人员,而只需使用lim cafe status命令以交互方式获取状态。 您还可以选择提供自己的会话ID(以确保与大型DF / IR工具链的其他部分保持一致)。
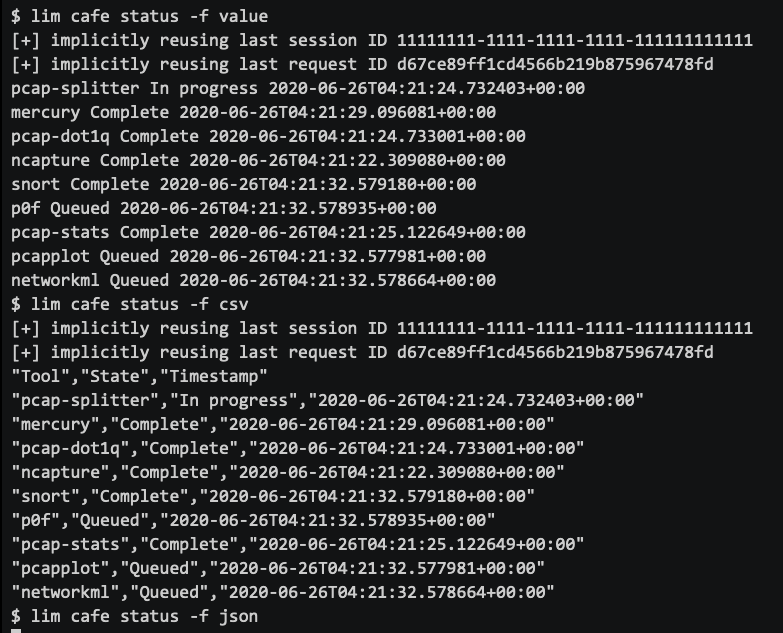
If you need to get output in another format for processing in a script, or importing into another security tool, you have several choices. You may want to do this for filtering on specific columns, piping into other programs, or inline command substitution feeding for loops.
如果您需要获取另一种格式的输出以在脚本中进行处理,或者导入到另一个安全工具中,则有多种选择。 您可能需要执行此操作,以对特定的列进行过滤,将for传递到其他程序中,或者将内联命令替换提供for循环。
An environment variable VOL_PREFIX must be set to point to a directory tree that will be volume mounted by the Docker containers. The workers create data under two primary directories. Files are stored in a directory whose path is ${VOL_PREFIX}/files and results from workers are stored in a directory whose path is ${VOL_PREFIX}/id. You should set this in your own shell configuration files, but lim will ensure it is set to the default described by IQTLabs before running Docker commands to get you going quicker.
必须将环境变量VOL_PREFIX设置为指向将由Docker容器卷挂载的目录树。 工作人员在两个主目录下创建数据。 文件存储在一个目录的路径是${VOL_PREFIX}/files从工人,结果被存储在一个目录的路径是${VOL_PREFIX}/id 。 您应该在自己的shell配置文件中进行设置,但是lim将确保在运行Docker命令之前将其设置为IQTLabs所描述的默认设置,以使您更快地入门。
Of course with a local Docker container deployment, you can list these files directly using the Linuxls, find, or tree commands. A fully-remote deployment will require using something like lim, which is ready to go!
当然,在本地Docker容器部署中,您可以使用Linux ls , find或tree命令直接列出这些文件。 完全远程部署将需要使用lim东西,随时可以使用!
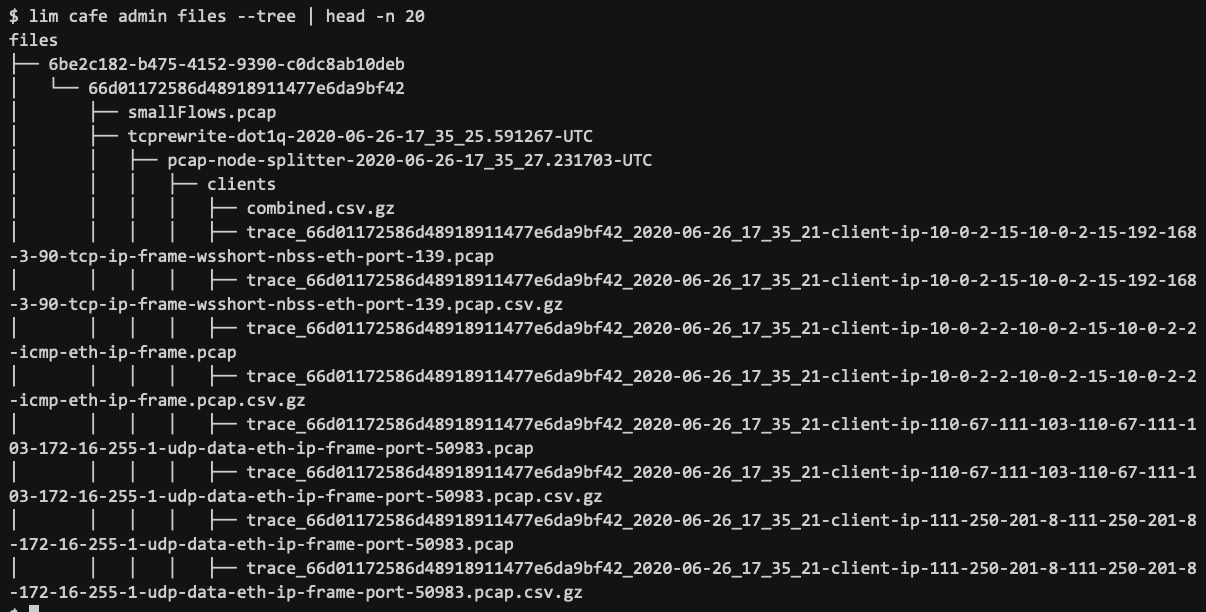
Each of these sets of data can be listed with lim cafe admin files and lim cafe admin results, respectively. Each of these commands has a --tree flag that will produce a more readable listing, as seen here:
这些数据集的每一个都可以分别与lim cafe admin files和lim cafe admin results一起列出。 这些命令中的每个命令都有一个--tree标志,该标志将产生更具可读性的列表,如下所示:

If you want to see the results from the workers at the command line (not in a browser), you can either get the raw results for a given tool or a rudimentary tabular report.
如果要在命令行(而不是在浏览器中)查看工作人员的结果,则可以获取给定工具的原始结果,也可以获取基本的表格报告。
Let’s look at the first bit of the raw output of the networkml worker. If you are running the command interactively from a command line with a TTY, the output will be pretty-printed with colorized syntax highlighting.
让我们看一下networkml worker的原始输出的第一位。 如果您从带有TTY的命令行以交互方式运行命令,则输出将以彩色语法高亮显示。

If running from a script in the background (or otherwise without a TTY), the output comes out as clean ASCII.
如果从后台脚本运行(或其他情况下没有TTY),则输出以纯ASCII格式输出。

Reports can be produced for those tools that produce JSON results. By default, all such tool results will be included in the report (use --help to see the list of available tools), but that gets to be pretty long in most cases. Here is the start of the report for just p0f (passive OS fingerprinting).
可以为那些生成JSON结果的工具生成报告。 默认情况下,所有这些工具结果都将包含在报告中(使用--help查看可用工具的列表),但是在大多数情况下,这会变得很长。 这只是p0f (被动OS指纹识别)报告的开始。

Note that if you take a close look at the top of a report from the pcap-stats tool, something might look a little familiar. It’s tshark and capinfos output! (I’ll leave that as an exercise for the reader. Hint: try lim cafe report --tool pcap-stats or just lim cafe report.)
请注意,如果您仔细查看pcap-stats工具中的报告顶部,可能会有些熟悉。 这是tshark和capinfos输出! (我将其留给读者作为练习。提示:尝试lim cafe report --tool pcap-stats或仅lim cafe report 。)
After a while, you will end up with several sessions (each with one or more requests). If the last session and request are no longer in the server (e.g. if you delete them with lim cafe admin delete), you will be prompted to interactively choose from available sessions and requests. (This feature uses the Python bullet module.) Or you can add the --choose flag to trigger the choice behavior yourself whenever you want.
一段时间后,您将结束几个会话(每个会话都有一个或多个请求)。 如果服务器中不再有最后一个会话和请求(例如,如果您使用lim cafe admin delete删除它们),则会提示您以交互方式从可用会话和请求中进行选择。 (此功能使用Python 项目符号模块。)或者,您可以添加--choose标志以随时触发自己的选择行为。

If you are just playing around or testing, you can clean up using the lim cafe admin delete command to delete specific sessions, or add the --all flag to delete all sessions.
如果您只是在玩耍或测试,则可以使用lim cafe admin delete命令删除特定会话,或者添加--all标志以删除所有会话进行清理。

Here is an asciinema asciicast showing all of the above (and more) in action:
这是一个显示以上所有(及更多)作用的子午线放映机:
开始的结尾 (The end of the beginning)
OK, that should be enough to get you started inspecting PCAP files! There is a lot more to experiment with and to explore, including using these tools in a realistic analytic case study mode.
好的,这足以让您开始检查PCAP文件! 还有更多的实验和探索,包括在现实的分析案例研究模式下使用这些工具。
Between the time I started writing this article in May and when I released lim-cli version 20.8.7 on August 26, I added functionality for listing, building, starting, stopping, updating, and deleting the Docker images and containers. I’ve submitted several successful Pull Requests to IQTLabs to add features that help independently develop and test code modifications and bug fixes, which I will cover in future articles.
从5月开始撰写本文到8月26日发布lim-cli版本20.8.7的这段时间之间,我添加了列出,构建,启动,停止,更新和删除Docker映像和容器的功能。 我已经向IQTLabs成功提交了多个请求请求,以添加有助于独立开发和测试代码修改和错误修复的功能,这些功能将在以后的文章中介绍。
There are still more features that would be nice to add to lim, like extending the PCAP editing features for production use (e.g., redacting data for sharing or publication), adding visualizations like the Nugache network graph I showed earlier, and adding more workers to Packet Café itself for running tools like Aguri and Zeek, etc. It’s looking like COVID-19 isn’t going to be over any time soon, so who knows? (If you happen to know of any grant or contract funding opportunities that can support this effort, please let me know! Or check out my GitHub page. I appreciate the help!)
还有更多可以添加到lim ,例如扩展PCAP编辑功能以供生产使用(例如,编辑数据以共享或发布),添加可视化效果(如我先前显示的Nugache网络图)以及向PacketCafé本身可用于运行Aguri和Zeek等工具。看起来COVID-19不会很快消失,所以谁知道呢? (如果您碰巧知道任何可以支持这项工作的赠款或合同资助机会,请告诉我!或查看我的GitHub页面 。感谢您的帮助!)
[Thanks to Dan Farmer and Charlie Lewis for their feedback on this article.]
[感谢Dan Farmer和Charlie Lewis对本文的反馈。]
翻译自: https://levelup.gitconnected.com/insight-into-network-packet-captures-7ed72ce310fe
洞悉netfilter


 914
914


 被折叠的 条评论
为什么被折叠?
被折叠的 条评论
为什么被折叠?
 到【灌水乐园】发言


