


datastudio使用
Screaming Frog is an amazing SEO tool for auditing almost any website. I have been using it for years, and it saved me a lot of time when auditing projects. At some point, I started needing recurrent SEO audits for some of my projects. Using the “Schedule” features of the tool, and a bit of Python code, I set up a solution that provided me and my team with updated information about the status of the site.
Screaming Frog是一款出色的SEO工具,可用于审核几乎所有网站 。 我已经使用了多年,在审核项目时节省了很多时间。 在某个时候,我开始需要为某些项目进行周期性的SEO审核 。 使用该工具的“计划”功能和一些Python代码,我建立了一个解决方案,向我和我的团队提供了有关该站点状态的更新信息。
解决方案背后的逻辑 (The logic behind the solution)
The idea behind the project is pretty simple. Using the schedule features in Screaming Frog, we could set up a crawl to run overnight. After the crawl, the files we needed would be saved in a folder, and called afterwards by a custom Python script, which we would use to modify and upload the files to our database. From there, it was just DataStudio doing it’s magic, with a Dashboard that included any information we needed.
该项目的想法很简单。 使用Screaming Frog中的计划功能 ,我们可以将爬网设置为在一夜之间运行。 爬网之后,我们需要的文件将保存在一个文件夹中, 然后由自定义Python脚本调用 ,我们将使用该脚本来修改文件并将其上传到数据库中。 从那里开始,只是DataStudio发挥了神奇作用,而Dashboard包含了我们所需的任何信息。
尖叫青蛙计划选项 (Screaming Frog Scheduling Options)
The first step towards implementing this solution, is properly scheduling the crawl you want to perform. In order to do this, open Screaming Frog and go to File -> Scheduling. Click on “+Add” in order to add a new scheduled crawl. In the “Start Options” tab, you can select the crawler mode, the crawl seed and the crawl configuration. (You can save a specific configuration for each project, depending on what you want to implement.)
实施此解决方案的第一步是正确计划要执行的爬网。 为此,请打开Screaming Frog,然后转到File-> Scheduling。 单击“ +添加”以添加新的预定爬网。 在“开始选项”选项卡中,可以选择搜寻器模式,搜寻种子和搜寻配置。 (您可以根据要实现的内容为每个项目保存特定的配置。)
In this tab you’ll also select which APIs you will use during the crawl.
在此标签中,您还将选择在爬网期间将使用的API。

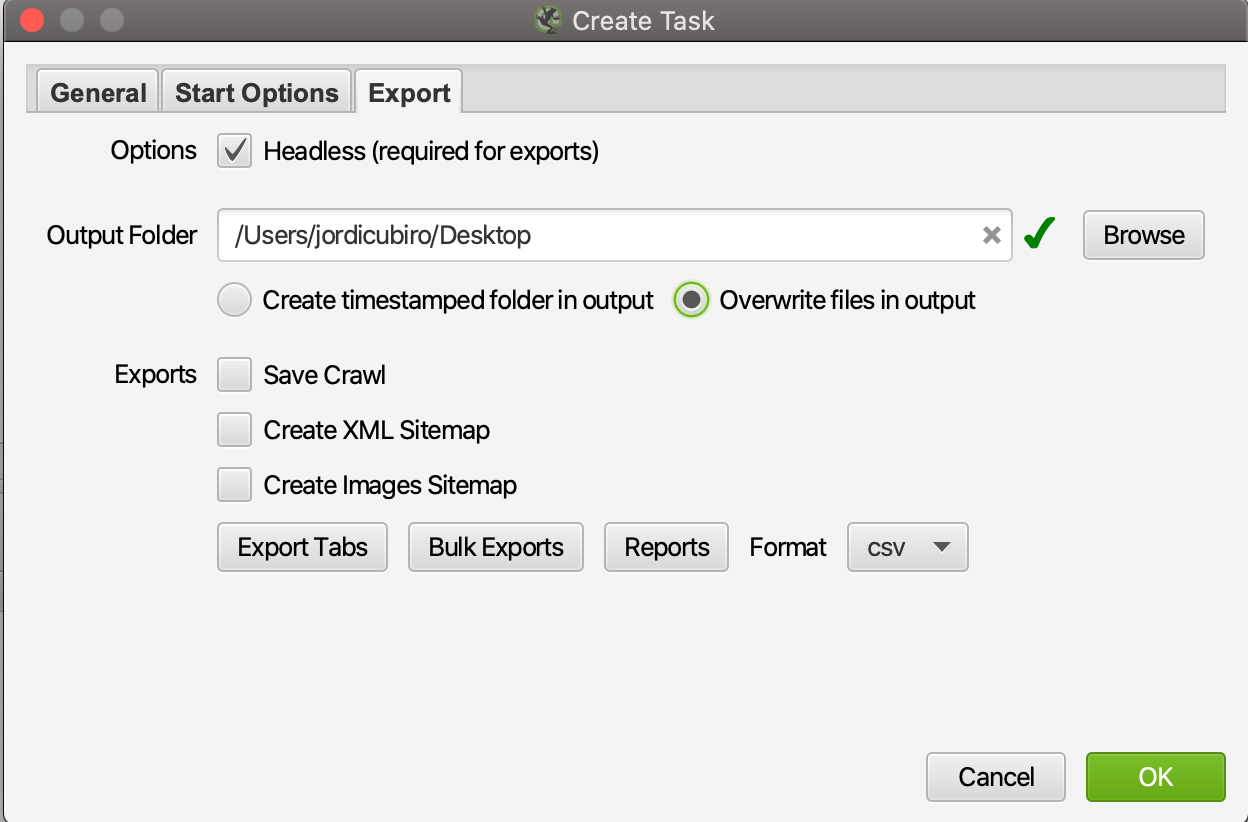
In the export tab, you’ll select which tabs of the report you want to save. For this script, I only saved “Internal:All” and “All Inlinks” (bulk export).
在导出标签中,您将选择要保存的报告标签 。 对于此脚本,我仅保存了“ Internal:All”和“ All Inlinks”(批量导出)。
Also, if you want to automate the report, I would recommend you choose to “Overwrite files in output”, for more simplicity when writing the script.
另外,如果要自动执行报告,我建议您选择“覆盖输出中的文件”,以简化编写脚本的过程。
自动化“尖叫青蛙”报告的Python脚本 (The Python Script to Automate Screaming Frog reporting)
At this point, Screaming Frog will crawl your site and then save the resulting crawl in a folder. From that folder, the files will be imported using the a python script. In a simplistic way, we could use just the following python script to upload the raw data into the database, without even modifying the dataframes.
此时,Screaming Frog将对您的网站进行爬网,然后将所得的爬网保存在文件夹中。 从该文件夹中,将使用python脚本导入文件。 以一种简单的方式,我们可以仅使用以下python脚本将原始数据上传到数据库中,而无需修改数据框。
# -- LIBRARIES IMPORT --
import numpy as np
import pandas as pd
import pymysql
from sqlalchemy import create_engine# Database Access
connector='mysql+pymysql://'
user='root'
password='your_password'
ip='@0.00.000.00'
db='name_of_your_database'
engine=connector+user+password+ip+db# Database Tables to be created
tables=["report","inlinks"]
method=["replace,"replace"]# DataFrames from CSV Files
PR=pd.read_csv("internal_all.csv")
IL=pd.read_csv("all_inlinks.csv")# Dataframes List for DB
Dataframes=[PR,DP]def toDB (dataframes,tables,method,engine):
    tablenumber=0
    n=0
    for df in dataframes:
        assignedtable=tables[tablenumber]
        methodus=method[n]
        try:
            sqlEngine =create_engine(engine, pool_recycle=3600)
            dbConnection=sqlEngine.connect()
            frame=df.to_sql(assignedtable, dbConnection, if_exists=methodus, index=False);
            tablenumber=tablenumber+1
            n=n+1

        except ValueError as vx:
            print(vx)

        except Exception as ex:
            print(ex)

        else:
            print("Table ",assignedtable," created successfully.");

        finally:
            dbConnection.close()
toDB(Dataframes,tables,method,engine)
With this script, it would be enough to upload the tables into the database. Nevertheless, we would be using too much space inefficiently, since many columns would be the same on both Dataframes. Therefore, the following functions may help you shape the data you want to upload.
使用此脚本,将表上载到数据库就足够了。 但是,由于两个数据帧上的许多列都是相同的,因此我们将效率低下地使用太多空间。 因此,以下功能可以帮助您调整要上传的数据。
您可能不需要的页面报告的删除列 (Dropping Columns of the Page Report you may not want)
Passing a list of columns to drop into this function will help you avoid duplicate columns in your DF tables.
将列列表传递给该函数将有助于您避免DF表中的重复列。
def droper(df,toDrop):
    try:
        for col in toDrop:
            if col in df.columns:
                del df[col]
    except:
        print('Could not drop',col
修改Python中每个数据框的标题 (Modify the headings of each Dataframe in Python)
Modify the heads of the dataframe so they are “database — friendly”.
修改数据框的头部,使它们“对数据库友好”。
def heads(DataFrames):
    try:
        for df in DataFrames:
            df.columns=df.columns.str.replace(' ','_')
            df.columns=df.columns.str.replace('-','_')
            df.columns=df.columns.str.lower()
    except:
        print("Heads Error")
从页面报告中定义集群并对数据进行分类 (Defining clusters and classifying data from the Page Report)
Sometimes you may want to classify data, and assign values to certain URLs. At first I tried to do so using CASE within DataStudio, which is a perfectly valid solution if your data is not very heavy. But when playing with big datasets, it is more efficient to set this classification within the script. Functions like the following can help you create clusters based on different data:
有时,您可能希望对数据进行分类,并为某些URL分配值。 最初,我尝试使用DataStudio中的CASE进行此操作,如果您的数据不是很繁重,这是一个非常有效的解决方案。 但是,在处理大型数据集时,在脚本中设置此分类会更有效。 类似于以下的功能可以帮助您基于不同的数据创建集群:
def TrafficClusters(row):
    try:
        if row['GA Users']==0 and row['Status']=='OK':
            val= "URLs with No Users"

        elif row['GA Users']>0 and row['GA Users']<=10:
            val= "Between 1 and 10 Users"elif row['GA Users']>11 and row['GA Users']<=30:
            val= "Between 11 and 30 Users"elif row['GA Users']>30 and row['GA Users']<=60:
            val= "Between 31 and 60 Users"elif row['GA Users']>60 and row['GA Users']<=100:
            val= "Between 61 and 100 Users"elif row['GA Users']>100 and row['GA Users']<=150:
            val= "Between 101 and 150 Users"elif row['GA Users']>150 and row['GA Users']<=250:
            val= "Between 151 and 250 Users"elif row['GA Users']>250 and row['GA Users']<=350:
            val= "Between 251 and 350 Users"elif row['GA Users']>350 and row['Status']=='OK':
            val= "More than 350 Users"else:
            val="URLs with No Users"

        return val

    except:
        print("Traffic Clusters Error")
在远程桌面上运行Python脚本 (Running the Python script in a Remote Desktop)
In order to run this script, I got inspired by this tutorial by IPullRank, on how to run Screaming Frog on AWS. I applied the same logic to my script, I launched and configured an instance. In order to properly install and configure Screaming Frog, I recommend you use a remote Desktop Application. Once you’ve installed Screaming Frog, you’ll need to set up the proper environment for Python to run. In order to do so, just install all the packages you use in your script, and download it in your desktop.
为了运行此脚本,我从IPullRank的本教程中学到了如何在AWS上运行Screaming Frog的灵感。 我将相同的逻辑应用于脚本,启动并配置了一个实例。 为了正确安装和配置Screaming Frog,我建议您使用远程桌面应用程序。 安装Screaming Frog之后,您需要为Python运行设置适当的环境。 为此,只需安装脚本中使用的所有软件包,然后将其下载到桌面即可。
After that, you can create a text file with the following commands, and save it in .bat format:
之后,您可以使用以下命令创建文本文件,并将其保存为.bat格式:
cd\
cd C:\Users\Administrator\Documents\yourauditfiles
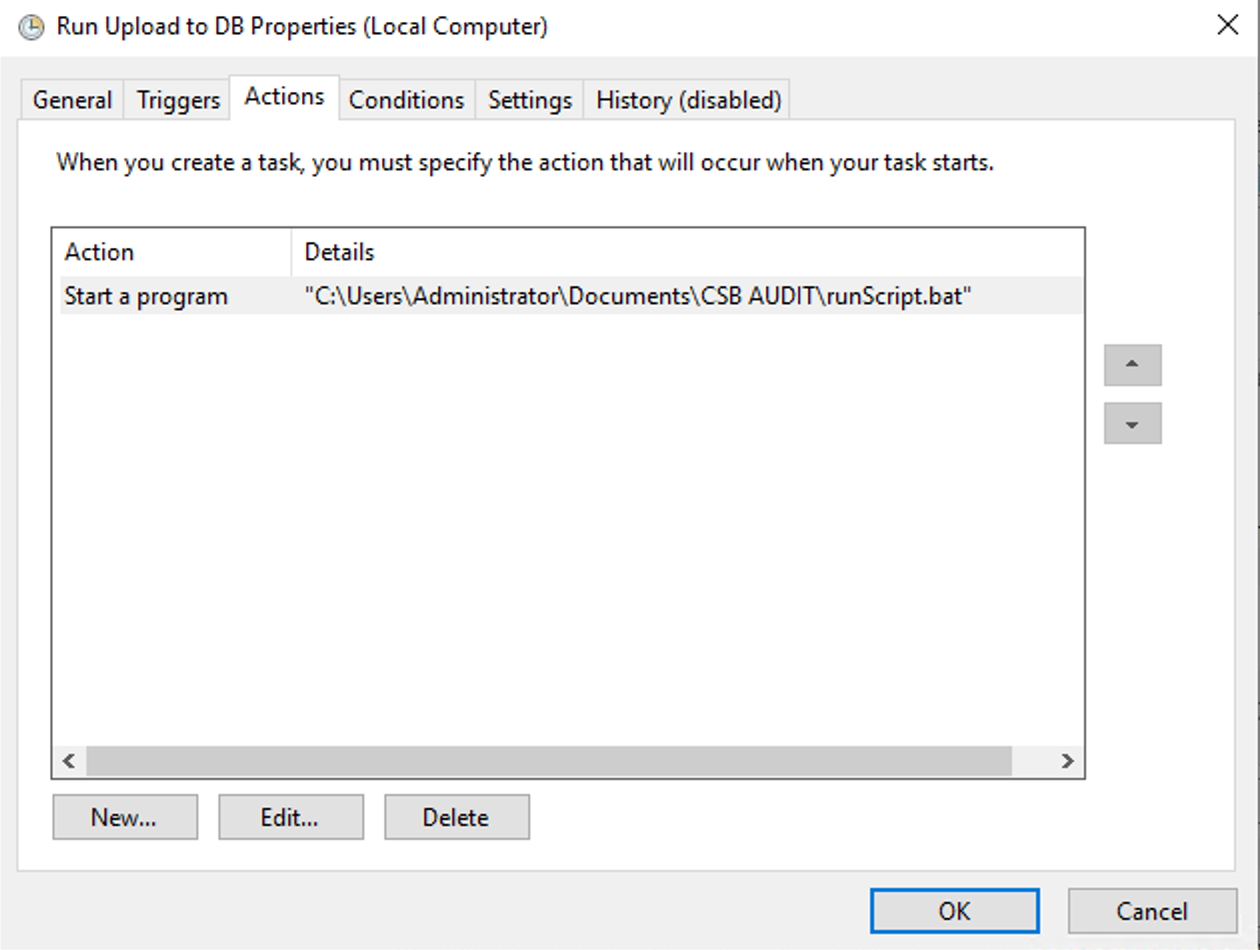
py thepythonscript.pyUsing task scheduler, you’ll be able to set up your computer to run the script anytime you want.
使用任务计划程序,您可以将计算机设置为随时运行脚本。
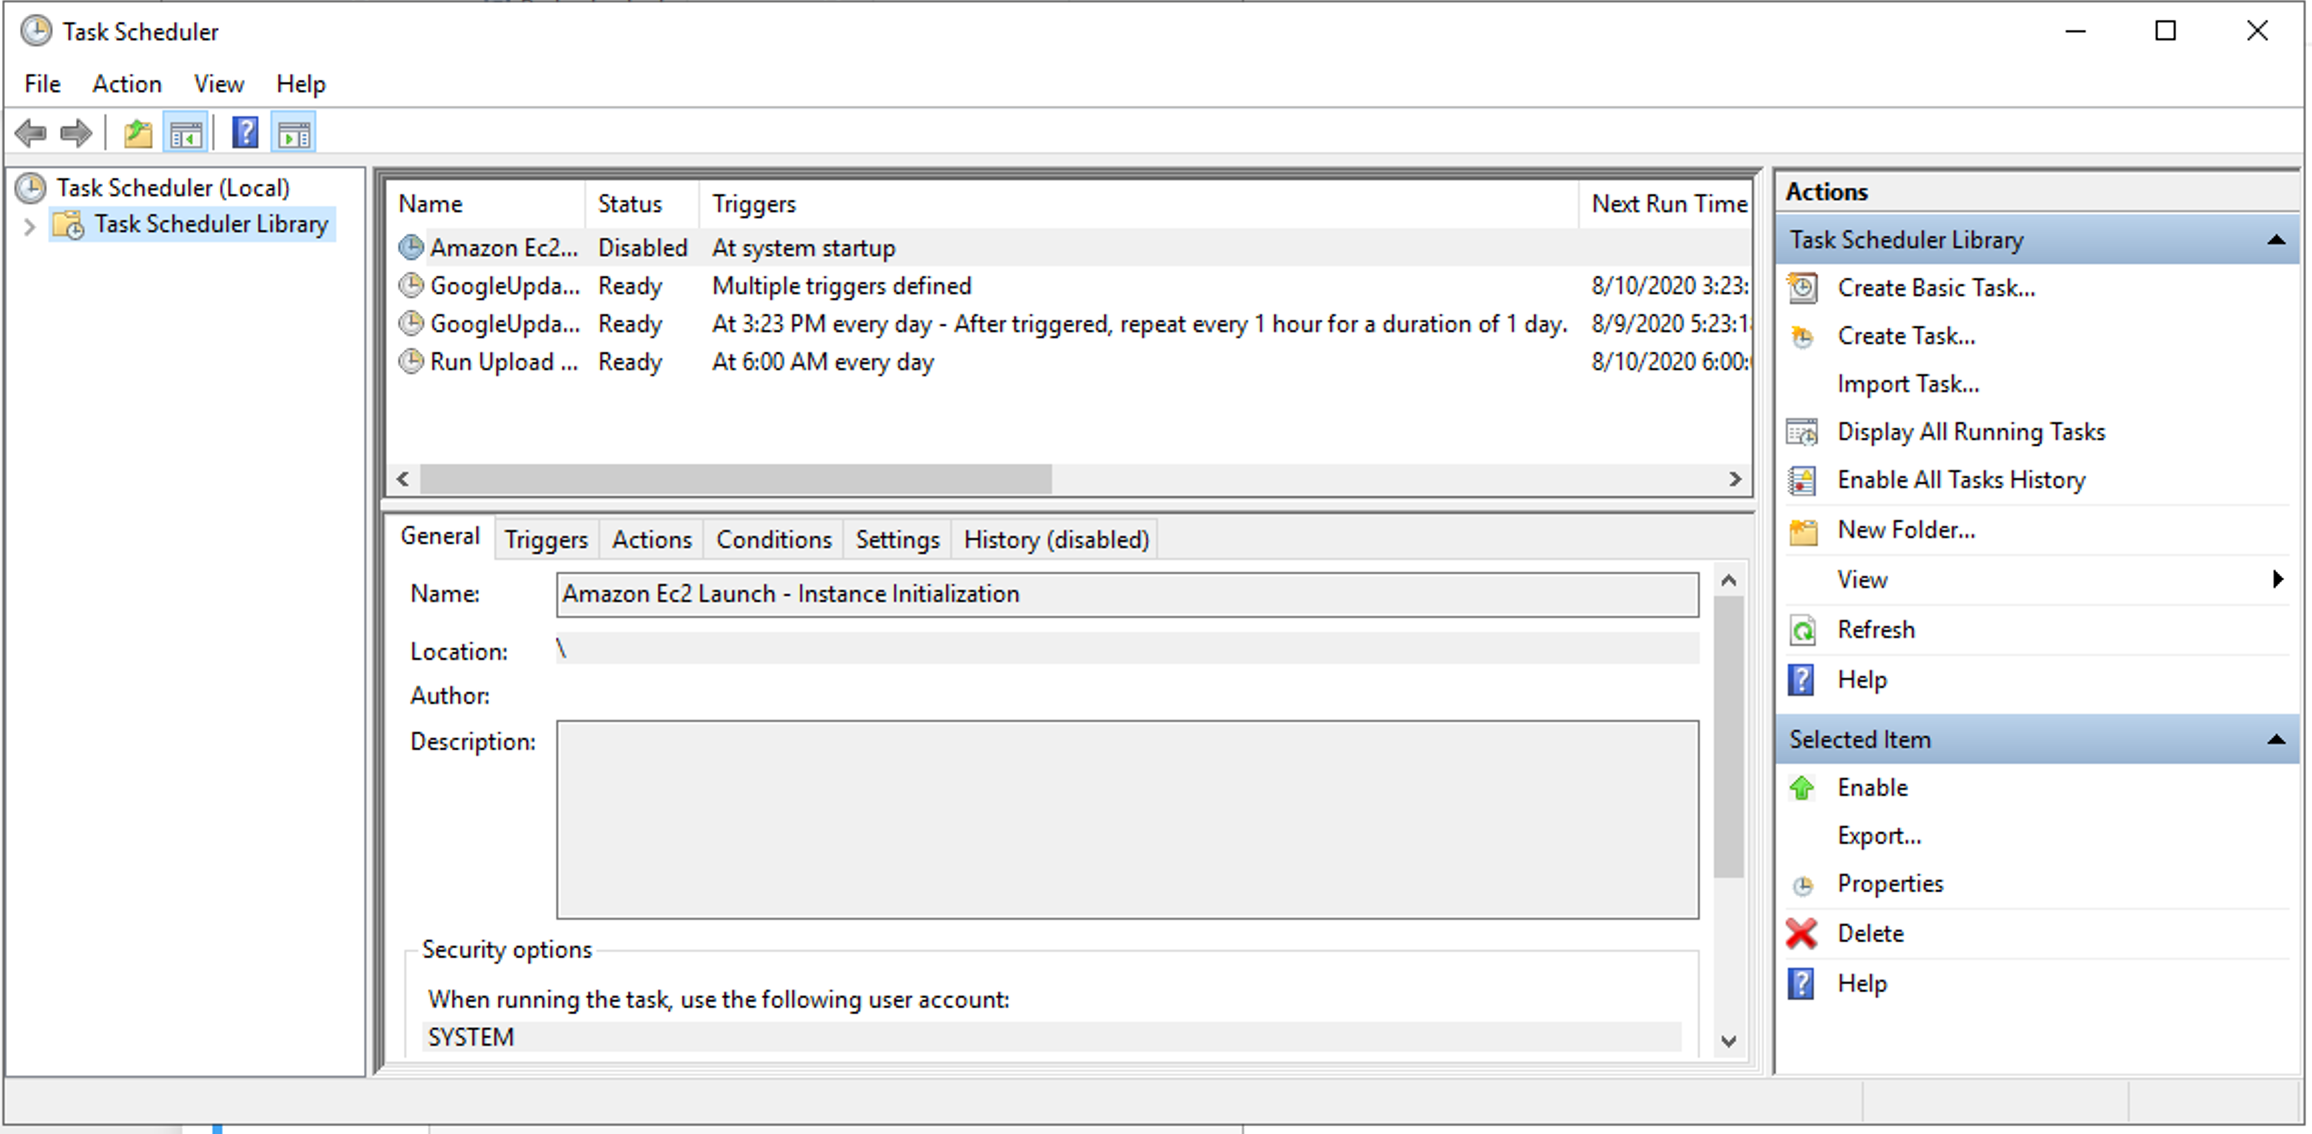
Just select “Create a task”, and under “Action” select “Start a Program” and the name fo your .bat file.
只需选择“创建任务”,然后在“操作”下选择“启动程序”和.bat文件的名称。
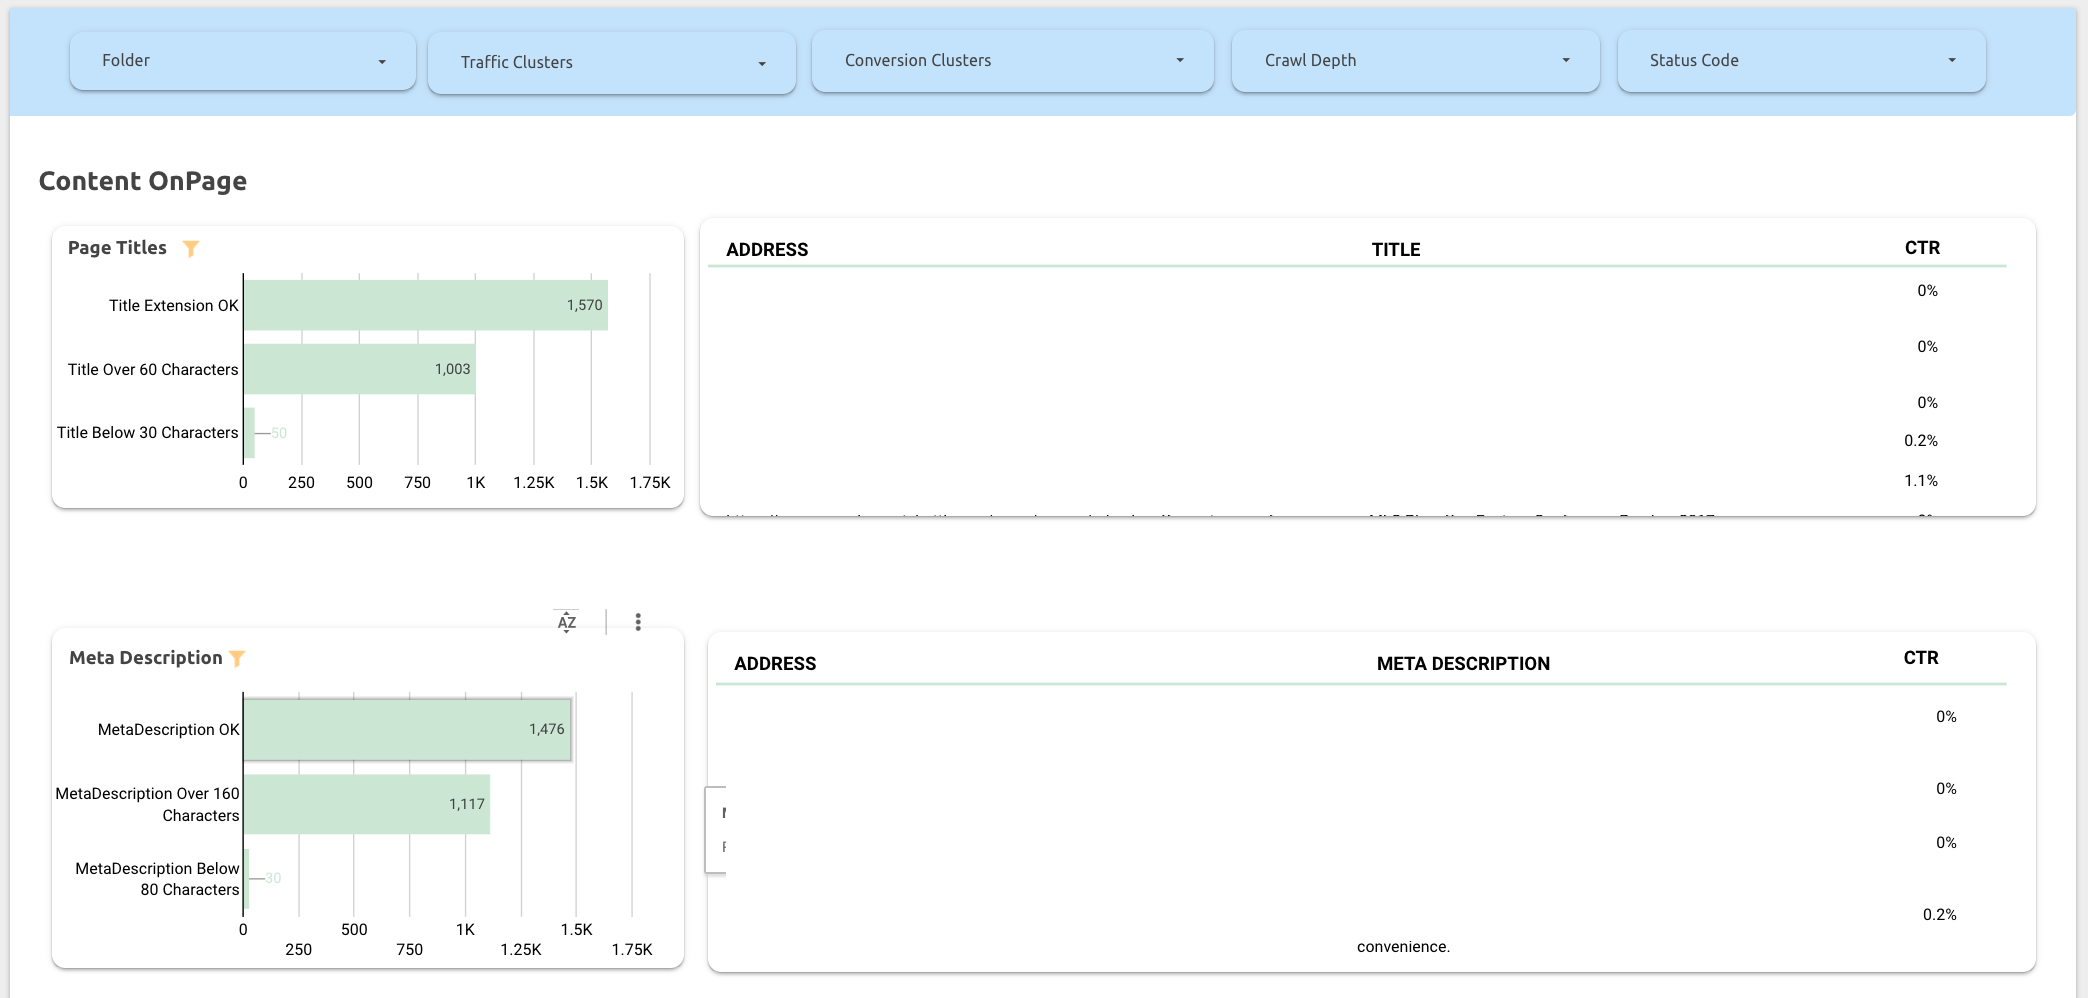
在DataStudio中绘制结果 (Plotting the results in DataStudio)
In order to plot the results in DataStudio, I would recommend using Cloud SQL. It’s fast and works perfectly fine with DataStudio, unless you are playing with a big amount of data. If that’s the case I would recommend switching from DS to Tableau, and maybe use another DataBase.
为了在DataStudio中绘制结果,我建议使用Cloud SQL 。 除非您要处理大量数据,否则它很快并且可以与DataStudio完美配合。 如果是这种情况,我建议您从DS切换到Tableau,并可能使用其他数据库。

datastudio使用


 833
833

 被折叠的 条评论
为什么被折叠?
被折叠的 条评论
为什么被折叠?
 到【灌水乐园】发言


