ios 通过时间分组
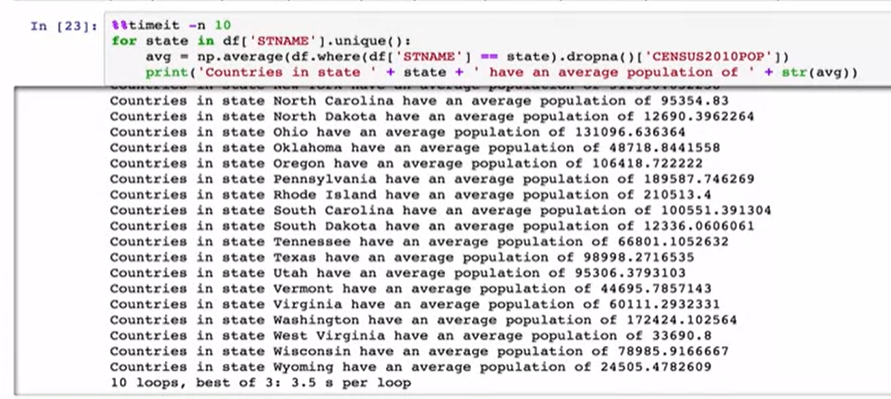
We’ve seen that even though PANDAS allows us to iterate over every row in a data frame this is generally a slow way to accomplish a given task and it’s not very pandorable. For instance, if we wanted to write some code to iterate over all the of the states and generate a list of the average census population numbers. We could do so using a loop in the unique function.
我们已经看到,尽管PANDAS允许我们遍历数据帧中的每一行,但这通常是完成给定任务的缓慢方法,并且也不是很可笑。 例如,如果我们想编写一些代码来遍历所有州并生成平均人口普查人口数量的列表。 我们可以在唯一函数中使用循环来实现。
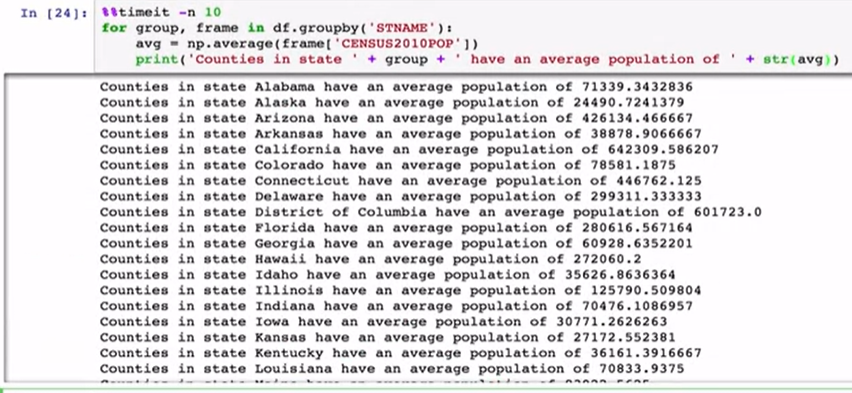
Another option is to use the dataframe group by function. This function takes some column name or names and splits the dataframe up into chunks based on those names, it returns a dataframe group by object. Which can be iterated upon, and then returns a tuple where the first item is the group condition, and the second item is the data frame reduced by that grouping.
另一个选择是按功能使用数据框。 此函数采用一个或多个列名称,然后根据这些名称将数据框分成多个块,然后按object返回一个数据框。 可以对其进行迭代,然后返回一个元组,其中第一项是分组条件,第二项是通过该分组减少的数据帧。
Since it’s made up of two values, you can unpack this, and project just the column that you’re interested in, to calculate the average.
由于它是由两个值组成的,因此您可以将其解压缩,然后仅投影您感兴趣的列,以计算平均值。
Here’s some examples of both methods in action. Let’s first load the census data, then exclude the state level summarizations which had a sum level of 40.
这是两种方法都起作用的一些示例。 我们首先加载人口普查数据,然后排除总级别为40的州级别摘要。
In the first we used the census date. We get a list of the unique states. Then for each state we reduce the data frame and calculate the average.
首先,我们使用人口普查日期。 我们获得了唯一状态的列表。 然后,对于每种状态,我们减少数据帧并计算平均值。

If we time this we see it takes a while. I’ve set the number of loops here the time it should take to ten because I’m live loading.Here’s the same approach with a group by object. We tell pandas we’re interested in group and with a state name and then we calculate the average using just one column and all of the data in that column. When we time it we see a huge difference in the speed.
如果时间到了,我们会花一些时间。 我已经在这里设置了循环次数,因为我正在实时加载,所以应该将其设置为十次。这里是按对象分组的相同方法。 我们用状态名称告诉熊猫我们对组感兴趣,然后我们仅使用一列和该列中的所有数据来计算平均值。 当我们计时的时候,我们会看到速度上的巨大差异。

Now, 99% of the time, you’ll use group by on one or more columns. But you can actually provide a function to group by as well and use that to segment your data. This is a bit of a fabricated example but lets say that you have a big batch job with lots of processing and you want to work on only a third or so of the states at a given time. We could create some function which returns a number between zero and two based on the first character of the state name. Then we can tell group by to use this function to split up our data frame. It’s important to note that in order to do this you need to set the index of the data frame to be the column that you want to group by first.Here’s an example. We’ll create some new function called fun and if the first letter of the parameter is a capital M we’ll return a 0. If it’s a capital Q we’ll return a 1 and otherwise we’ll return a 2. Then we’ll pass this function to the data frame reply, and see that the data frame is segmented by the calculated group number.
现在,有99%的时间,您将在一个或多个列上使用分组依据。 但实际上,您也可以提供一个分组功能,并使用该功能对数据进行细分。 这是一个虚构的示例,但可以说您有一个处理大量事务的批处理作业,并且想要在给定时间只处理三分之一左右的状态。 我们可以创建一些函数,该函数根据状态名称的第一个字符返回介于零和两个之间的数字。 然后,我们可以告诉group by使用此功能拆分数据帧。 重要的是要注意,要执行此操作,您需要将数据框的索引设置为要首先分组的列。以下是一个示例。 我们将创建一个名为fun的新函数,如果参数的第一个字母为大写字母M,则返回0。如果为大写字母Q,则返回1,否则返回2。将这个函数传递给数据帧回复,并查看数据帧是否按计算出的组号进行了分段。

This kind of technique, which is sort of a light weight hashing, is commonly used to distribute tasks across multiple workers. Whether they are cores in a processor, nodes in a supercomputer, or disks in a database.
这种技术是一种轻量级哈希,通常用于在多个工作人员之间分配任务。 它们是处理器中的核心,超级计算机中的节点还是数据库中的磁盘。
A common work flow with group bias that you split your data, you apply some function, then you combine the results. This is called split apply combine pattern. And we’ve seen the splitting method, but what about apply? Certainly iterative methods as we’ve seen can do this, but the groupby object also has a method called agg which is short for aggregate. This method applies a function to the column or columns of data in the group, and returns the results.
具有组偏差的常见工作流程是拆分数据,应用某些功能,然后合并结果。 这称为拆分应用合并模式。 我们已经看到了拆分方法,但是该怎么办呢? 正如我们所见,当然迭代方法可以做到这一点,但是groupby对象也有一个称为agg的方法,它是聚合的缩写。 此方法将函数应用于组中数据的一个或多个列,并返回结果。

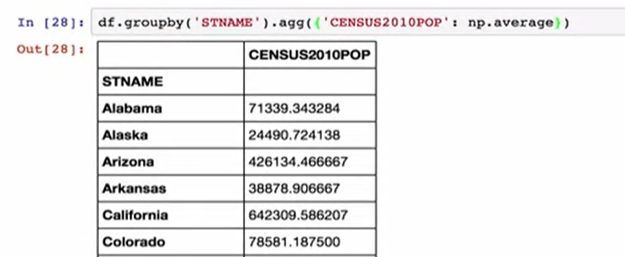
With agg, you simply pass in a dictionary of the column names that you’re interested in, and the function that you want to apply. For instance to build a summary data frame for the average populations per state, we could just give agg a dictionary with the Census 2010 pop key and the numb/pie average function.
使用agg,您只需传入您感兴趣的列名和要应用的函数的字典即可。 例如,要为每个州的平均人口建立一个汇总数据框,我们可以给agg一个带有Census 2010 pop键和numb / pie average函数的字典。

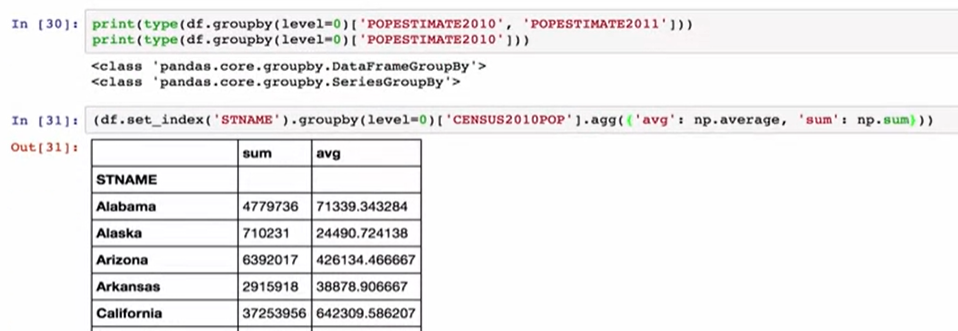
Now, I want to flag a potential issue and using the aggregate method of group by objects. You see, when you pass in a dictionary it can be used to either to identify the columns to apply a function on or to name an output column if there’s multiple functions to be run. The difference depends on the keys that you pass in from the dictionary and how they’re named.In short, while much of the documentation and examples will talk about a single groupby object, there’s really two different objects. The data frame group and the series groupby. And these objects behave a little bit differently with aggregate.
现在,我要标记一个潜在的问题,并使用按对象分组的聚合方法。 您会看到,当您传递字典时,它可以用于标识要在其上应用函数的列,或者在要运行多个函数的情况下命名输出列。 不同之处取决于您从字典中传入的键及其命名方式。简而言之,尽管许多文档和示例都只讨论一个 groupby对象,实际上有两个不同的对象。 数据框分组和系列分组。 这些对象的行为与聚合略有不同。

For instance, we take our census data and convert it into a series with the state names as the index and only columns as the census 2010 population. And then we can group this by index using the level parameter. Then we call the agg method where the dictionary that has both the numpie average and the numpie sum functions. PANDAS applies those functions to the series object and, since there’s only one column of data It apples both functions to that column and prints out the output.We can do the same thing with a data frame instead of a series. We set the index to be the state name, we group by the index, and we project two columns.
例如,我们将人口普查数据转换为以州名作为索引而仅将列作为2010年人口普查人口的序列。 然后我们可以使用level参数按索引将其分组。 然后,我们调用agg方法,其中既具有numpie平均值又具有numpie sum函数的字典。 PANDAS将这些函数应用于序列对象,由于只有一列数据,因此将这两个函数都应用到该列并打印输出。我们可以对数据框而不是序列执行相同的操作。 我们将索引设置为状态名称,将索引分组,然后投影两列。

The population estimate in 2010, the population estimate in 2011. When we call aggregate with two parameters, it builds a nice hierarchical column space and all of our functions are applied. Where the confusion can come in is when we change the labels of the dictionary we passed to aggregate, to correspond to the labels in our group data frame. In this case, pandas recognize that they’re the same and map the functions directly to columns instead of creating a hierarchically labeled column. From my perspective, this is very odd behavior, not what I would expect given the labeling change. So just be aware of this when using the aggregate function.So that’s the group by function. I use the group by function regularly in my work, and it’s very handy for segmenting a data frame, working on small pieces of the data frame, and then creating bigger data frames later.
2010年的人口估算值,2011年的人口估算值。当我们使用两个参数调用聚合时,它将建立一个不错的层次结构列空间,并且我们所有的函数都将被应用。 当我们更改传递给聚合的字典的标签以对应于组数据框中的标签时,可能会造成混乱。 在这种情况下,大熊猫会认识到它们是相同的,并将功能直接映射到列,而不是创建带有层次结构的标签列。 从我的角度来看,这是非常奇怪的行为,考虑到标签更改,这不是我期望的。 所以在使用聚合函数时要注意这一点,这就是按功能分组。 我在工作中定期使用按功能分组,这对于分割数据框,处理数据框的小块然后在以后创建更大的数据框非常方便。
https://www.coursera.org/learn/python-data-analysis/lecture/yO8DX/group-by
https://www.coursera.org/learn/python-data-analysis/lecture/yO8DX/group-by
翻译自: https://medium.com/python-in-plain-english/group-by-8450c7414b6c
ios 通过时间分组


 被折叠的 条评论
为什么被折叠?


