


归因分析
By Lisa Cohen, Ryan Bouchard, Jane Huang, Daniel Yehdego and Siddharth Kumar
由 丽莎·科恩 , 瑞安布沙尔 , 黄美珍 , 丹尼尔Yehdego 和 亚洲时报Siddharth库马尔
介绍 (Introduction)
This is our second article in a series where we focus on methods for determining the impact of customer engagement efforts, a common question that data scientists face in the enterprise. In our last article, we showed methods for attribution analysis in cases where there are one or many treatments in play (using single or multi-attribution). Those methods provide ways to quantify the correlation between treatments and outcome metrics. In this article, we’ll cover causal inference techniques to determine causality. We’ll also share approaches that we’ve taken to make this analysis actionable for the business.
这是我们系列的第二篇文章,我们重点介绍确定客户参与工作影响的方法,这是数据科学家在企业中面临的一个常见问题。 在上一篇文章中 ,我们展示了在进行一种或多种治疗(使用单一或多种归因)的情况下的归因分析方法。 这些方法提供了量化治疗与结果指标之间相关性的方法。 在本文中,我们将讨论因果推断技术以确定因果关系。 我们还将分享使该分析对企业可行的方法。
因果推论 (Causal inference)
We’ve discussed the distinction between techniques that allow us to conclude correlation versus those that indicate causation. “Correlation does not imply causation” is a common reminder in the field of statistics and data science. This site features several amusing spurious correlations to remind us about the importance of not conflating these two concepts. Another method (beyond randomized controlled trials “RCTs”) that we use to evaluate causation is causal inference. This is particularly valuable in scenarios where it’s not feasible to run an experiment due to business considerations. The Book of Why, by Judea Pearl, is a fun and accessible read for those interested in an introduction to this topic. The Coursera course “A Crash Course in Causality: Inferring Causal Effects from Observational Data” is another good reference.
我们已经讨论了允许我们得出相关性的技术与表明因果关系的技术之间的区别。 “关联不表示因果关系”是统计和数据科学领域的常见提示。 该站点具有几个有趣的虚假关联,以提醒我们不要混淆这两个概念的重要性。 我们用来评估因果关系的另一种方法(超出随机对照试验“ RCT”)是因果推断 。 在出于商业考虑而无法进行实验的情况下,这特别有价值。 Judea Pearl撰写的《为什么》一书对那些对此主题介绍感兴趣的人来说是一本有趣且容易阅读的书。 Coursera课程“ 因果关系速成课程:从观测数据推断因果效应 ”是另一个很好的参考。
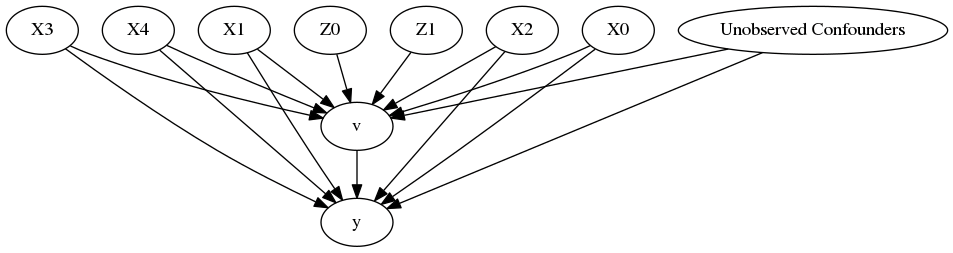
The first step in causal modeling is to develop the causal diagram. A key activity as part of this work is hypothesizing the variables that could have an impact on the outcomes, which requires a combination of business context and a healthy dose of imagination. A good approach to this is asking “What if?” questions. Causal diagrams include the treatment under review, the desired goal or outcome, and confounding variables (i.e., other variables that can also have an impact on the outcome):
因果建模的第一步是开发因果图 。 作为这项工作的一部分,一项关键活动是假设可能影响结果的变量,这需要结合业务环境和健康的想象力。 一个很好的方法是问“如果?” 问题。 因果图包括正在审查的治疗,期望的目标或结果以及混淆的变量(即,其他也会影响结果的变量):
In our example above, the treatment is the investment program that is aimed at helping customers be successful in their adoption of the Azure cloud. A key outcome we measure is their usage of Azure. Finally, the confounding variables include customer size, geography, industry, types of Azure services used, usage levels, and so on. Ultimately, confounding variables include many of the factors that you would typically control for in a RCT.
在上面的示例中, 治疗是一种投资计划,旨在帮助客户成功采用Azure云。 我们衡量的关键结果是对Azure的使用。 最后, 令人困惑的变量包括客户规模,地理位置,行业,所使用的Azure服务类型,使用级别等。 最终,混杂变量包括许多您通常在RCT中要控制的因素。
We also consider instrumental variables, which don’t influence the outcome directly but have an impact on the treatment and therefore affect the outcome indirectly. For example, someone’s attitude toward safety influences their likelihood to wear a seatbelt, as well as their driving practices, which both lead to safety results. Similarly, someone’s lifestyle affects their likeliness of taking prescribed medications, as well as maintaining other healthy habits, which in turn lead to health results. In the context of our scenarios, the relative effectiveness and attitudes of different program administrators have an impact on the program engagement and ultimately program results. Therefore if the assignment of program administrators is random, we can consider the program administrator assignment to be an instrumental variable and use an algorithm like double least square to estimate treatment effects.
我们还考虑了仪器变量 ,这些变量不会直接影响结果,但会影响治疗并因此间接影响结果。 例如,某人对安全的态度会影响他们系上安全带的可能性以及驾驶习惯,这都会导致安全后果。 同样,某人的生活方式会影响他们服用处方药以及维持其他健康习惯的可能性,从而导致健康结果。 在我们的方案中,不同计划管理员的相对有效性和态度会对计划参与度和最终计划结果产生影响。 因此,如果程序管理员的分配是随机的,我们可以将程序管理员的分配视为工具变量,并使用像双最小二乘这样的算法来估计治疗效果。
Here is what our resulting causal diagram looks like:
这就是我们产生的因果关系图:
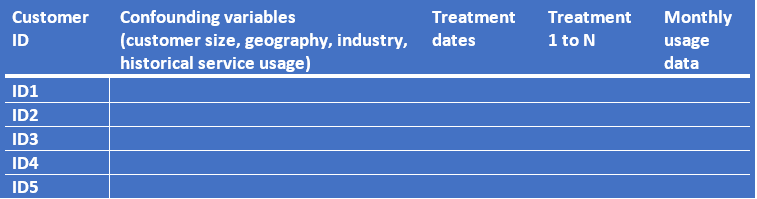
Once we define the causal diagram, next we compile the data. Here are the dimensions we include for the current example:
一旦定义了因果图,接下来我们将编译数据。 以下是我们为当前示例提供的尺寸:
For causal inference modeling, developing the dataset is one of the most critical — albeit time-consuming — parts of the process. Basically, we need to construct a control and treatment that have matching confounding variable values, as if we had set them up as a controlled experiment to begin with. Then we can run the usual statistical tests, prove or disprove hypotheses, and determine causality. In the case of a single attribution (single treatment) problem, we can directly compare these two groups, either by matching subsets of the population (if the sample size is large enough) or by comparing larger populations with matching frequencies of the confounding variables.
对于因果推理建模,开发数据集是过程中最关键(尽管很耗时)的部分之一。 基本上,我们需要构造一个具有匹配的混杂变量值的对照和处理方法,就好像我们将它们设置为受控实验一样。 然后,我们可以运行常规的统计检验,证明或反驳假设,并确定因果关系。 在单一归因(单一处理)问题的情况下,我们可以通过匹配总体子集(如果样本量足够大)或通过比较更大的总体和混杂变量的匹配频率来直接比较这两组。
In the case of a multi-attribution problem with n treatments, we can either model each investment separately and control for all other investments, or allow a combination of treatments in the treatment space and then allocate the treatment effects to each investment.
对于具有n种处理的多属性问题,我们可以分别为每个投资建模并控制所有其他投资,或者允许在处理空间中组合处理,然后将处理效果分配给每个投资。
One challenge that we face in this work is to ensure that our treatment and “constructed control” are appropriately matched with respect to the confounding variables. Here are a few techniques that we leverage for this:
我们在这项工作中面临的一个挑战是,要确保我们的治疗和“结构化控制”在混杂变量方面适当匹配。 这是我们可以利用的一些技术:
- Covariate matching: Obtain treated and controlled groups with similar covariate distributions (in our case, the confounding variables above) so that we can replicate a randomized experiment as closely as possible. 协变量匹配:获得具有相似协变量分布的治疗组和对照组(在我们的情况下,是上面的混杂变量),以便我们可以尽可能地复制随机实验。
Propensity score matching (PSM) (as outlined in Stuart, Elizabeth 2010): Estimate the effect of an intervention by accounting for the covariates that predict receiving the treatment. (In the case of our example, propensity refers to the propensity for a customer to participate in a particular program.)
倾向得分匹配(PSM)(如Stuart,Elizabeth 2010所述 ):通过考虑预测接受治疗的协变量来估计干预措施的效果。 (在我们的示例中,倾向性是指客户参与特定程序的倾向性。)
- Propensity score weighting: Weigh the data based on the propensity scores. Add larger weight to individuals who are underrepresented in the sample and a lower weight to those who are over-represented. Then analyze the weighted sample. (This is the method that we actually use in the current example.) 倾向得分加权:根据倾向得分对数据进行加权。 给样本中代表性不足的个体增加较大的权重,为样本过多的个体增加较小的权重。 然后分析加权样本。 (这是我们在当前示例中实际使用的方法。)
In additional to the above traditional approaches for average treatment effect, a core problem that arises in data-driven personalized decision scenarios is the estimation of heterogeneous treatment effects: What is the effect of an intervention on an outcome of interest as a function of a set of observable characteristics of the treated sample? More and more techniques at the intersection of econometrics and machine learning are gaining popularity to tackle the problem of heterogeneous treatment effect estimation. Those methods offer flexibility in modeling effect heterogeneity, while at the same time leveraging techniques from causal inference and econometrics to preserve the causal interpretation of the learned model and usually also offer statistical validity via the construction of valid confidence intervals. The Microsoft Research ALICE team has developed a Python library called EconML, which is a collection of state-of-the-art techniques under a common API, for the estimation of heterogeneous treatment effects from observational data via machine learning. We utilize approaches from this package such as meta learners and double machine learnings for investment recommender.
除了上述传统的平均治疗效果方法之外,在数据驱动的个性化决策场景中出现的核心问题是对异构治疗效果的估计:干预对目标结果的影响是一组的函数处理样品的可观察特征? 计量经济学和机器学习相交的越来越多的技术正逐渐普及,以解决异构治疗效果估计的问题。 这些方法提供了建模效果异质性的灵活性,同时利用因果推理和计量经济学的技术来保留对学习模型的因果解释,并且通常还通过构造有效的置信区间来提供统计有效性。 微软研究院的ALICE团队已经开发了一个名为EconML的Python库,该库是通用API下的最新技术的集合,用于通过机器学习从观测数据中评估异构处理效果。 我们利用此软件包中的方法,例如元学习者和双重机器学习作为投资推荐者。
Ultimately, causal inference is an approach to reach a conclusion where we can state “we controlled for all the important features that could confound results, enough so that you can interpret the results as if a controlled experiment was run.” That, in itself, is a high bar and requires a deep understanding of the business context, our customers, and how customers use our services. However, it is required in order to remove the typical selection bias that otherwise exists when comparing customer populations who participated in a program versus those who did not.
最终,因果推理是一种得出结论的方法,在该结论中,我们可以声明“我们控制了所有可能混淆结果的重要特征, 因此您可以像运行受控实验一样解释结果 。” 这本身就是一个很高的标准,需要深入了解业务环境,我们的客户以及客户如何使用我们的服务。 但是,为了消除在比较参加计划的客户群体与未参加计划的客户群体时否则存在的典型选择偏差,这是必需的。
Another challenge we face in these types of problems is determining whether our causal diagram is complete, and reflecting on “what we know” versus “what we don’t know” regarding the mechanisms leading to our desired outcome. One effective technique we’ve found is to test model performance by using the placebo treatment as explained in the refutation methods section of the DoWhy package by Amit Sharma, Emre Kiciman, et al., “DoWhy: A Python package for causal inference,” 2019. Essentially, we modify the dataset by randomly switching customers’ treatment programs and observe the impact on the model results. This shows us how sensitive the model is to the feature and indicates that our treatment variables have a significant impact on the model outcome.
在这些类型的问题中,我们面临的另一个挑战是确定因果图是否完整,并在导致期望结果的机制上反思“我们知道”与“我们不知道”。 我们发现一种有效的技术是使用安慰剂治疗来测试模型的性能,如Domit包的反驳方法部分( 由Amit Sharma,Emre Kiciman等人撰写的“ DoWhy:用于因果推理的Python包”)所述。 2019年 本质上,我们通过随机切换客户的处理程序来修改数据集,并观察对模型结果的影响。 这向我们展示了模型对特征的敏感程度,并表明我们的治疗变量对模型结果具有重大影响。
归因洞察力带动行动 (Driving action with attribution insights)
In data science, ultimately we don’t want to just produce data points, we want to drive decisions and actions. So, what can we actually do with this attribution work? Of course, if we find that one program is more effective than another, we may choose to modify our program investments to invest more in higher ROI activities. However, more often we find that we want to use this data to improve our existing programs.
在数据科学中,最终我们不想只产生数据点,而是要推动决策和行动。 那么,我们实际上可以做些什么? 当然,如果我们发现一个计划比另一个计划更有效,我们可以选择修改计划投资,以更多地投资于更高的ROI活动。 但是,更多时候我们发现我们想使用这些数据来改进我们现有的程序。
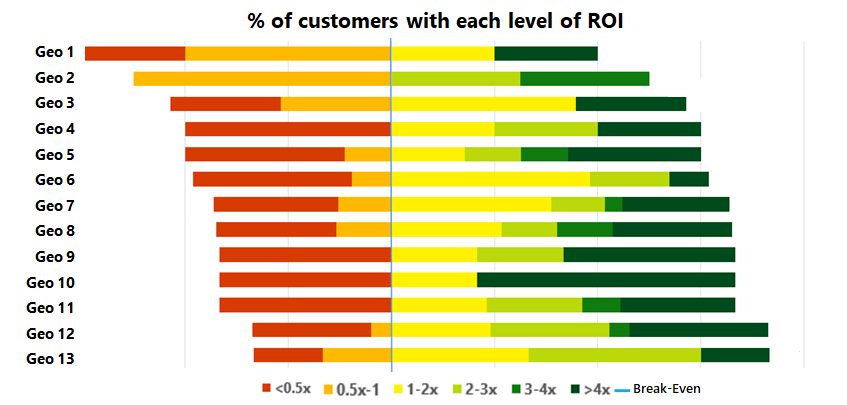
For example, we can explore the ROI of a program by geography (or various other dimensions) in order to learn where it’s working better (versus worse) and then dig in further to understand why. Here is an example of a program, where we analyze the ROI for customers, by geo:
例如,我们可以按地理位置(或其他各种维度)来探索某个程序的投资回报率,以了解该程序在哪里工作得更好(相对于更糟),然后进一步挖掘原因。 这是一个程序示例,其中我们按地理位置分析了客户的投资回报率:
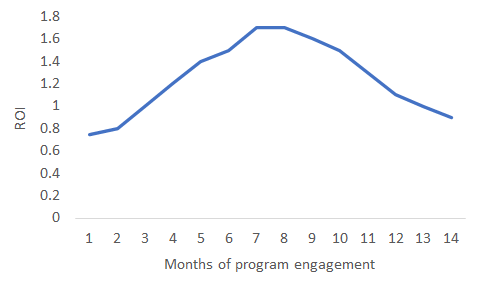
In the multi-attribution scenario, we can also conduct “path analysis” to learn which combinations, durations, and orders of programs are most effective. In the example below, we find that a particular (sample) program yields maximum ROI at seven months of duration. This insight can help inform how long we engage (although we may still choose to continue engaging after the ROI peak, if the program continues to have enough impact):
在多属性场景中,我们还可以进行“路径分析”以了解哪种组合,持续时间和节目顺序最有效。 在下面的示例中,我们发现一个特定的(示例)程序在七个月的时间里可获得最大的ROI。 这种见解可以帮助告知我们参与的时间(尽管如果该计划继续产生足够的影响,我们仍可以选择在ROI达到峰值后继续参与):
Another useful perspective is to consider the combination and sequencing of investments. In the example below we see that investments B and C are most effective when they’re used in combination together, and even more so when they are preceded by A:
另一个有用的观点是考虑投资的组合和顺序。 在下面的示例中,我们看到,将投资B和C结合在一起使用时最有效,而在A后面加上A则更有效:

Using this dataset, we also turn our descriptive analytics into predictive analytics and build recommendation models. In one scenario, we develop a “program-level” model to predict which customers will benefit most from a particular program. Using this model, we’re able to provide the program owners with a sorted list of potential customers, as well as “model explanation” details, summarizing the factors that led to each customer’s recommendation.
使用此数据集,我们还将描述性分析转变为预测性分析并建立推荐模型。 在一种情况下,我们开发了一种“程序级”模型来预测哪些客户将从特定程序中受益最大。 使用此模型,我们可以为计划所有者提供潜在客户的排序列表以及“模型说明”详细信息,以汇总导致每个客户推荐的因素。
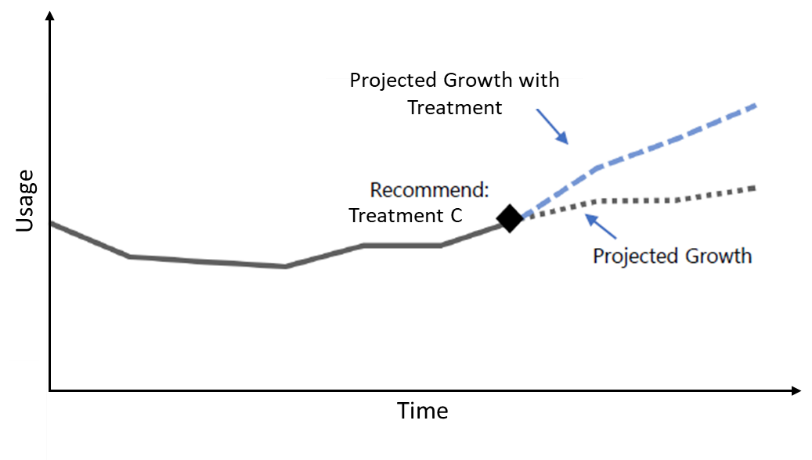
We also construct a “customer-level” model to recommend which program a customer would benefit from most, next. (Of course, this also requires program capacity.) The figure below shows an example of the “customer-level” model, where we recommend treatment C for the customer and predict how much the customer will grow with the treatment (beyond the otherwise projected baseline).
我们还构建了一个“客户级”模型,以推荐下一个客户将从大多数程序中受益的程序。 (当然,这也需要程序容量。)下图显示了“客户级别”模型的示例,在该模型中,我们为客户推荐治疗C,并预测该治疗将使客户增长多少(超出了其他预期的范围)基准)。
进一步阅读:归因建模的历史 (Further reading: A history of attribution modeling)
Those interested in data-driven attribution modeling might be interested in the following resources, which have been important research contributions to this field:
那些对数据驱动的归因建模感兴趣的人可能对以下资源感兴趣,这些资源是该领域的重要研究贡献:
Shao and Li (2011) developed a bagged logistic regression model to predict how investments from different programs lead to conversion or revenue uplift. One potentially limiting assumption in their models is that investments have the same effect regardless of their order (i.e. whether they were the first investment that the consumer received or the tenth).
Shao and Li(2011)开发了一种袋装逻辑回归模型,以预测不同计划的投资如何导致转化或收入增加。 在他们的模型中,一个潜在的限制性假设是,无论其顺序如何,投资都具有相同的效果(即,它们是消费者获得的第一笔投资还是第十笔)。
Dalessandro et al. (2012) extended this research by incorporating the sequence of investments that lead consumers to their final conversion status or revenue uplift.
Dalessandro等。 (2012)扩展了这项研究,纳入了导致消费者达到最终转化状态或收入增长的投资顺序。
Li and Kannan (2014) used a Bayesian framework to understand how consumers interact with a firm using different online channels. One of the findings of their experiment is that online channels exhibit significant carryover and spillover effects among themselves.
Li和Kannan(2014)使用贝叶斯框架来了解消费者如何使用不同的在线渠道与公司互动。 他们实验的发现之一是,在线渠道之间相互之间表现出显着的结转和溢出效应。
Wiesel et al. (2011) considered the applied nature of the literature and focused on methodologies that can easily be implemented by marketers and financiers to perform attribution.
Wiesel等。 (2011年)考虑了文献的应用性质,并侧重于营销商和金融家可以轻松实施以进行归因的方法。
Ron Berman (2018) proposed a game theory approach to analytically devise allocation and payment rules for multi-channel ads, in his article “Beyond the Last Touch: Attribution in Online Advertising.”
罗恩·伯曼(Ron Berman(2018))在他的文章“超越最后一触:在线广告中的归因”中提出了一种博弈论方法,以分析性地设计多渠道广告的分配和支付规则。
结论 (Conclusion)
In this post, we’ve shared causal inference methods for determining whether a customer nurture activity caused a specific desired result. We also explored applications including recommendation models, that data scientists can use to make these insights actionable for the business. We hope these examples can be helpful for your work as well. Please leave a comment to share your attribution scenarios and the techniques you use today.
在这篇文章中,我们共享了因果推理方法来确定客户的培育活动是否导致了特定的预期结果。 我们还探索了包括推荐模型的应用程序,数据科学家可以使用这些模型来使这些见解对企业可行。 我们希望这些示例也可以对您的工作有所帮助。 请发表评论,分享您的归属情况和您今天使用的技术。
I’d like to acknowledge Saptarshi Chaudhuri, Shijing Fang, Saurabh Kumar, and Deepsha Menghani, who have been significant contributors to this work.
我要感谢 Saptarshi Chaudhuri , Shijing Fang , Saurabh Kumar 和 Deepsha Menghani ,他们是这项工作的重要贡献者。
归因分析


 被折叠的 条评论
为什么被折叠?
被折叠的 条评论
为什么被折叠?
 到【灌水乐园】发言


