


 本文介绍了如何利用Python的Folium模块来展示和分析地理空间数据,提供了从数据到地图的转换方法。
用folium模块画地理图
As a part of the Data Science community, Geospatial data is one of the most crucial kinds of data to work with. The applications are as simple as ‘Where’s my food delivery order right now?’ and as complex as ‘What is the most optimal path for the delivery guy?’
作为数据科学社区的一部分,地理空间数据是最重要的数据类型之一。 申请就像“我现在的外卖订单在哪里?”一样简单。 就像“送货员的最佳路径是什么?”一样复杂。
是什么把我带到了Folium? (What brought me to Folium?)
I was recently working on a data science problem involving a lot of gps coordinates. Obviously the very basic question — how do I represent these coordinates on a map in my jupyter notebook? And while we know that plotly, geopy and basemap get the job done, this is the first time I came across Folium and decided to give it a go!
我最近正在研究一个涉及许多gps坐标的数据科学问题。 显然,这是一个非常基本的问题-如何在jupyter笔记本中的地图上表示这些坐标? 虽然我们知道plotly , geopy和basemap可以完成工作,但这是我第一次遇到Folium并决定尝试一下!
This article is a step by step tutorial on representing your data using folium.
本文是有关使用folium表示数据的分步教程。
介绍 (Introduction)
Folium essentially is used for generating interactive maps for the browser (inside notebooks or on a website). It uses leaflet.js , a javascript library for interactive maps.
Folium本质上用于为浏览器(在笔记本内部或网站上)生成交互式地图。 它使用leaflet.js (用于交互式地图的javascript库)。
To put it in a one-liner: Manipulate your data in Python, then visualize it in on a Leaflet map via folium.
要将其放在一个直线上: 用Python处理数据,然后通过叶片将其可视化在Leaflet地图上。
Step 1: Installing folium on the computer and importing the necessary packages.
步骤1: 在计算机上安装大叶草并导入必要的软件包。
!pip install foliumimport numpy as np
import pandas as pd
import matplotlib.pyplot as plt
from sklearn import preprocessing
import scipy## for geospatial
import folium
import geopy
We will work with the Fire from Space: Australia dataset.
Step 2: Loading and inspecting the dataset.
步骤2: 加载和检查数据集。
df = pd.read_csv("fire_archive_M6_96619.csv")
Step 3: Finding the coordinates to begin with.
步骤3: 找到要开始的坐标。
We can either pick a set of coordinates from the dataset itself or we can use geopy for this purpose. Here, we are talking about Australian wildfires so I started with Melbourne for reference.
我们可以从数据集本身中选择一组坐标,也可以为此使用geopy。 在这里,我们谈论的是澳大利亚的山火,所以我从墨尔本开始作为参考。
city = "Melbourne"
# get location
locator = geopy.geocoders.Nominatim(user_agent="My app")
city = locator.geocode(city)
location = [city.latitude, city.longitude]
print(city, "\n[lat, long]:", location)
Step 4: Plotting on the map.
步骤4: 在地图上绘制。
Plotting points on a map in Folium is like building a house. You lay the base (that’s your background map) and then you add points on top of it’s surface.
在Folium地图上绘制点就像在盖房子。 放置基础(即背景图),然后在其表面顶部添加点。
We shall first lay the base.
我们首先要打基础。
map_ = folium.Map(location=location, tiles="cartodbpositron",
                  zoom_start=8)
map_
You can also play around with the tileset and zoom by referring here.
您还可以通过参考此处来玩游戏并缩放。
Now we plot the points on the map. We shall color-code according to the attribute ‘type’ and size it as per the ‘brightness’ of the fire. So let’s get those attributes in order first.
现在我们在地图上绘制点。 我们将根据属性“类型”对代码进行颜色编码,并根据火的“亮度”对其进行大小调整。 因此,让我们先按顺序获取这些属性。
# create color column to correspond to type
colors = ["red","yellow","orange", "green"]
indices = sorted(list(df["type"].unique()))
df["color"] = df["type"].apply(lambda x:
               colors[indices.index(x)])
## scaling the size
scaler = preprocessing.MinMaxScaler(feature_range=(3,15))
df["size"] = scaler.fit_transform(
               df['brightness'].values.reshape(-1,1)).reshape(-1)
We finally add points on top of the map using folium.
最后,我们使用叶片将点添加到地图顶部。
df.apply(lambda row: folium.CircleMarker(
           location=[row['latitude'],row['longitude']],
           popup=row['type'],
           color=row["color"], fill=True,
           radius=row["size"]).add_to(map_), axis=1)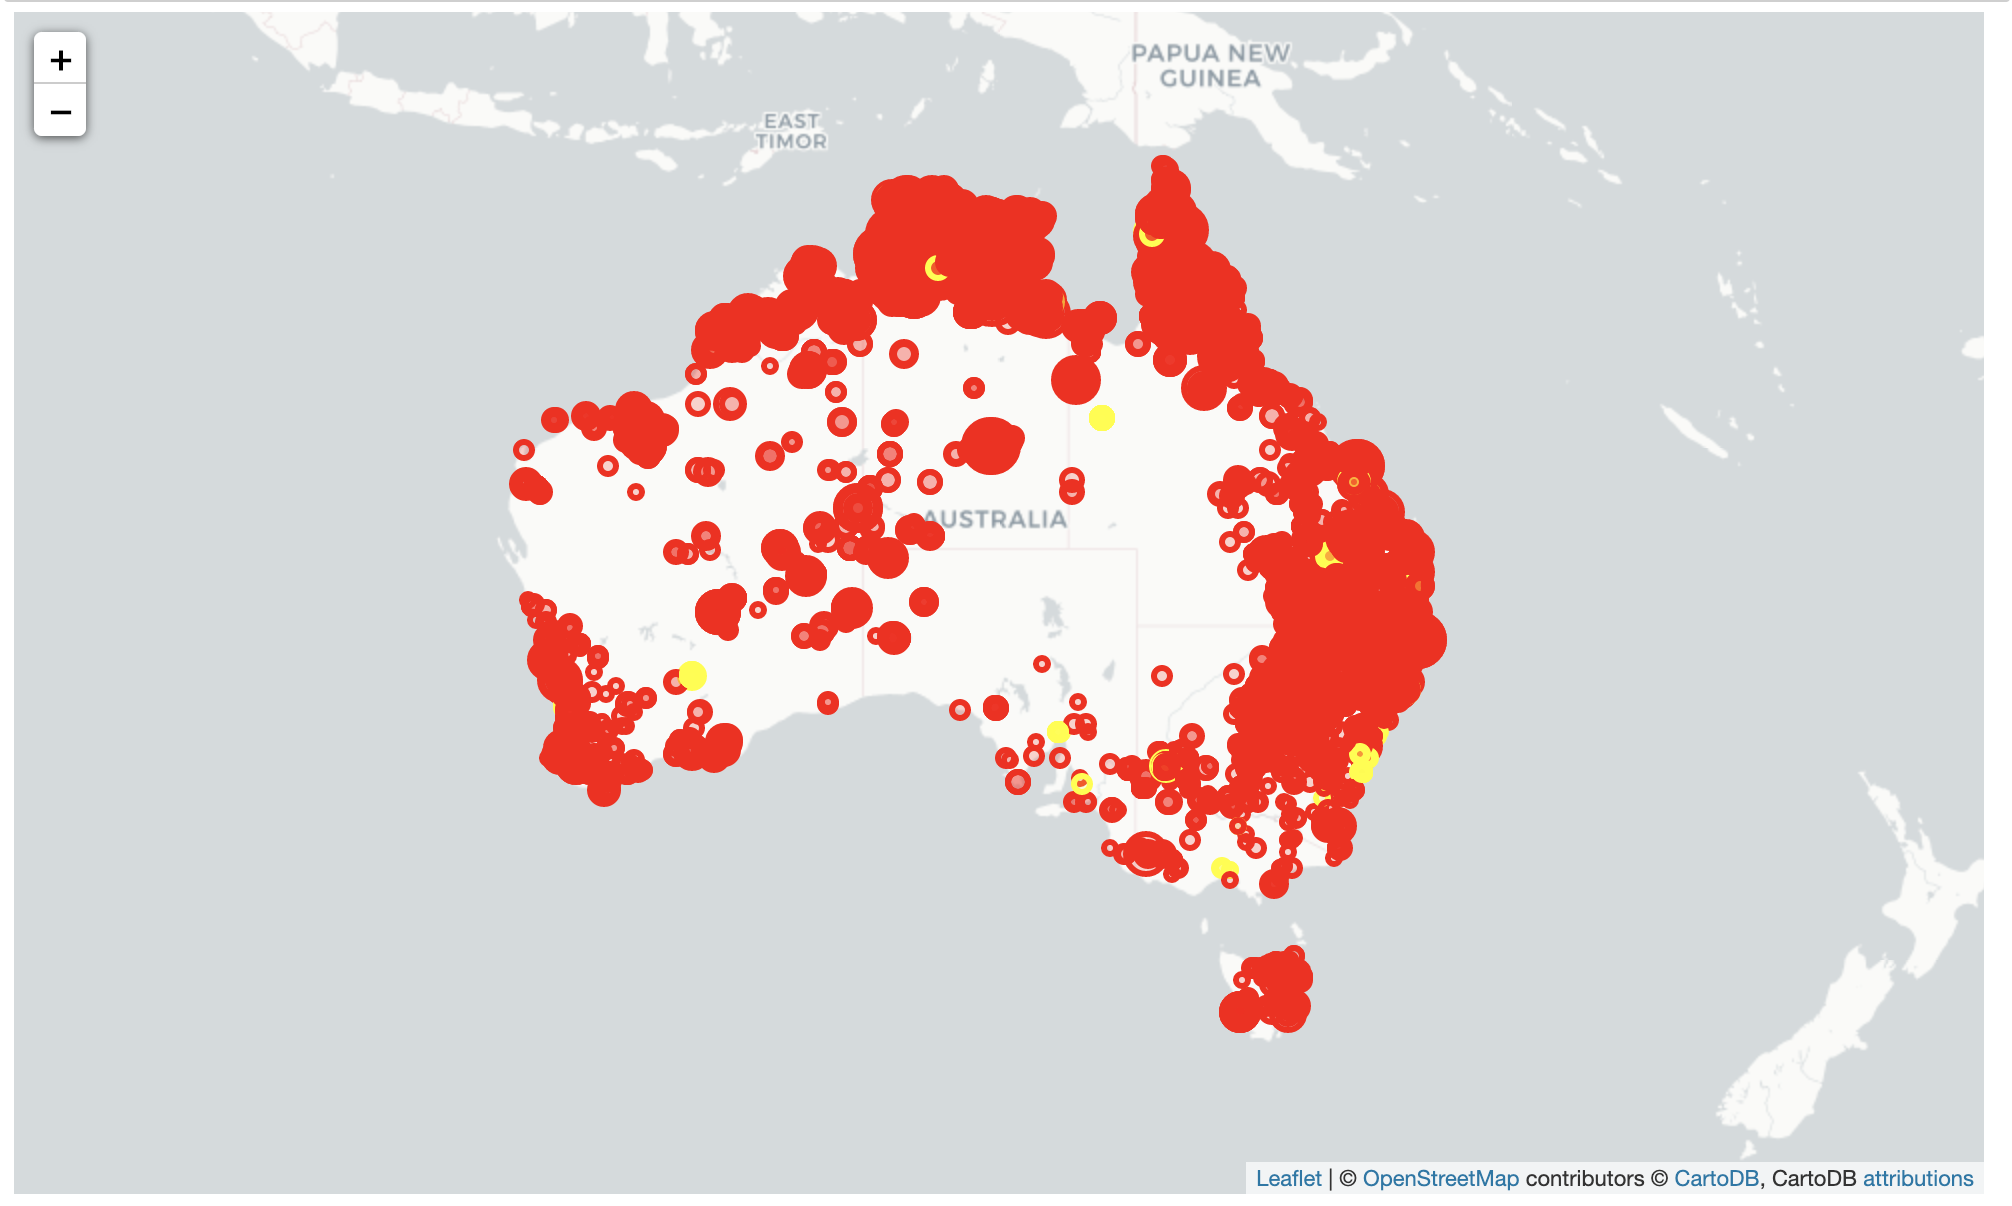
Finally, we move to adding a legend to the map. I used this reference for adding a legend. There are a variety of other methods but this was what I found the easiest.
最后,我们开始向地图添加图例。 我使用此参考来添加图例。 还有许多其他方法,但这是我发现的最简单的方法。
legend_html = """<div style="position:fixed;
top:10px; right:10px;
border:2px solid black; z-index:9999;
font-size:14px;"> <b>"""+color+""":</b><br>"""
for i in lst_elements:
legend_html = legend_html+""" <i class="fa fa-circle
fa-1x" style="color:"""+lst_colors[lst_elements.index(i)]+"""">
</i> """+str(i)+"""<br>"""
legend_html = legend_html+"""</div>"""
map_.get_root().html.add_child(folium.Element(legend_html))#plot
map_
Here’s the whole piece of code:
这是整个代码段:
import numpy as np
import pandas as pd
import matplotlib.pyplot as plt
from sklearn import preprocessing
import scipy
## for geospatial
import folium
import geopydf = pd.read_csv("fire_archive_M6_96619.csv")city = "Melbourne"
# get location
locator = geopy.geocoders.Nominatim(user_agent="My app")
city = locator.geocode(city)
location = [city.latitude, city.longitude]
print(city, "\n[lat, long]:", location)map_ = folium.Map(location=location, tiles="cartodbpositron",
zoom_start=8)# create color column to correspond to type
colors = ["red","yellow","orange", "green"]
indices = sorted(list(df["type"].unique()))
df["color"] = df["type"].apply(lambda x:
colors[indices.index(x)])
## scaling the size
scaler = preprocessing.MinMaxScaler(feature_range=(3,15))
df["size"] = scaler.fit_transform(
df['brightness'].values.reshape(-1,1)).reshape(-1)df.apply(lambda row: folium.CircleMarker(
location=[row['latitude'],row['longitude']],
popup=row['type'],
color=row["color"], fill=True,
radius=row["size"]).add_to(map_), axis=1)legend_html = """<div style="position:fixed;
top:10px; right:10px;
border:2px solid black; z-index:9999;
font-size:14px;"> <b>"""+color+""":</b> <br>"""
for i in lst_elements:
legend_html = legend_html+""" <i class="fa fa-circle
fa-1x" style="color:"""+lst_colors[lst_elements.index(i)]+"""">
</i> """+str(i)+"""<br>"""
legend_html = legend_html+"""</div>"""
map_.get_root().html.add_child(folium.Element(legend_html))
#plot
map_You can also find it on my Github. Hope this article helped.
您也可以在我的Github上找到它。 希望本文对您有所帮助。
翻译自: https://towardsdatascience.com/represent-your-geospatial-data-using-folium-c2a0d8c35c5c
用folium模块画地理图


 1万+
1万+

 被折叠的 条评论
为什么被折叠?
被折叠的 条评论
为什么被折叠?
 到【灌水乐园】发言


