


power bi 中计算
Just recently, I’ve come across a question on the LinkedIn platform, if it’s possible to create the following visualization in Power BI:
就在最近,我是否在LinkedIn平台上遇到了一个问题,是否有可能在Power BI中创建以下可视化文件:
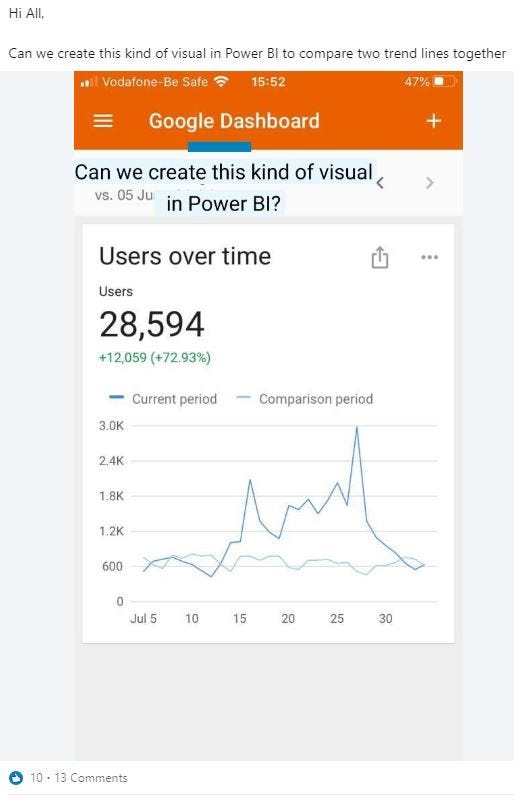
Since one of the common business requests is to perform different comparisons between various time periods, I would say that Power BI has a lot to offer in this regard. I’ve already explained some basic calculations related to Time Intelligence, but there are obviously a significant number of users who are not quite familiar with them.
由于常见的业务请求之一是在不同时间段之间执行不同的比较,因此我想说Power BI在这方面可以提供很多帮助。 我已经解释了一些与时间智能有关的基本计算方法 ,但是显然有很多用户对它们不太熟悉。
First of all, I would like to emphasize a great feature called “Quick Measures”, where you get out-of-the-box solutions for multiple commonly used calculations, such as: Year-to-date total, Quarter-to-date total, Month-to-date total, Year-over-year change, Rolling Average, etc.
首先,我想强调一个称为“快速度量”的出色功能,在该功能中,您将获得针对多种常用计算的开箱即用解决方案,例如:年初至今总计,季度初至今总数,本月至今的总数,同比变化,滚动平均值等。
In order for Quick Measures to work, you need to have a properly defined Date table.
为了使“快速度量”起作用,您需要具有正确定义的“
 最低0.47元/天 解锁文章


 9514
9514


 被折叠的 条评论
为什么被折叠?
被折叠的 条评论
为什么被折叠?
 到【灌水乐园】发言


