


React Native Debugger is a powerful tool that helps developers debug React Native applications more quickly. It provides a suite of impressive features, such as UI inspector, redux inspector, breakpoints and networking inspector. In this article, we are going to learn how to install and use the React Native Debugger, which will boost your development productivity by an order of magnitude.
React Native Debugger是一个功能强大的工具,可帮助开发人员更快地调试React Native应用程序。 它提供了一套令人印象深刻的功能,例如UI检查器,redux检查器,断点和网络检查器。 在本文中,我们将学习如何安装和使用React Native Debugger,这将使您的开发效率提高一个数量级。
In layman’s terms, a Debugger is a tool used for debugging. If you are a developer of any programming background, you must have already come across a debugger in your life. React Native Debugger is a standalone debugger tool built using the Electron framework. You can easily integrate this debugger tool along with the Chrome Dev tool. This debugger tool is based on the remote debugger which is included in React Native out of the box. However, the React Native debugger packs a lot more features than the remote one.
用外行的术语来说,调试器是用于调试的工具。 如果您是一名具有任何编程背景的开发人员,那么您一定已经遇到过调试器。 React Native Debugger是使用Electron框架构建的独立调试器工具。 您可以轻松地将此调试器工具与Chrome开发工具集成在一起。 该调试器工具基于现成的React Native中包含的远程调试器。 但是,React Native调试器比远程调试器具有更多功能。
安装React Native调试器 (Installing React Native Debugger)
The installation process is quite easy. We can simply download the latest installation file from the release page. For macOS, we can use Homebrew Cask to install. We can run the following command in the terminal:
安装过程非常简单。 我们可以简单地从发行页面下载最新的安装文件。 对于macOS,我们可以使用Homebrew Cask进行安装。 我们可以在终端中运行以下命令:
$ brew update && brew cask install react-native-debuggerAfter installation, simply open the React Native Debugger.app file in your Applications folder (or use Spotlight search to locate it).
安装后,只需打开Applications文件夹中的React Native Debugger.app文件(或使用Spotlight搜索找到它)。
使用React Native调试器 (Using The React Native Debugger)
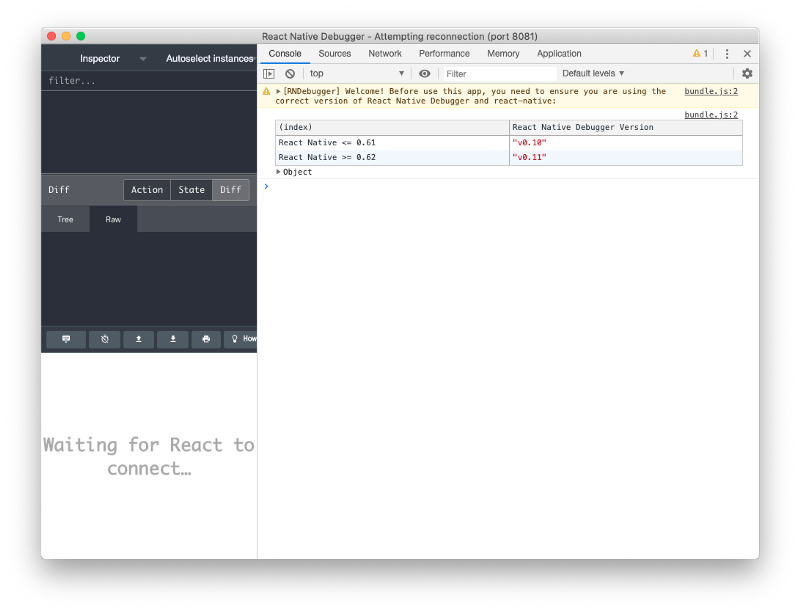
After a successful installation, we can simply open the React Native Debugger launch file. Hence, we will see the re-connection status on the title bar of the debugger app window. The debugging process will be executed on port 8081 as shown in the screenshot below:
成功安装后,我们可以简单地打开React Native Debugger启动文件。 因此,我们将在调试器应用程序窗口的标题栏上看到重新连接状态。 调试过程将在端口8081上执行,如以下屏幕截图所示:
Now when we run the React Native App on debug mode, we no longer need to open the browser. To have your React Native app enter debug mode, simply shake your device and choose “Debug” in the menu that pops up. If you are on a simulator, simply press Command + Shift + Z to open the menu.
现在,当我们在调试模式下运行React Native App时,我们不再需要打开浏览器。 要使您的React Native应用程序进入调试模式,只需摇晃您的设备并在弹出的菜单中选择“调试”。 如果您使用的是模拟器,只需按Command + Shift + Z打开菜单。
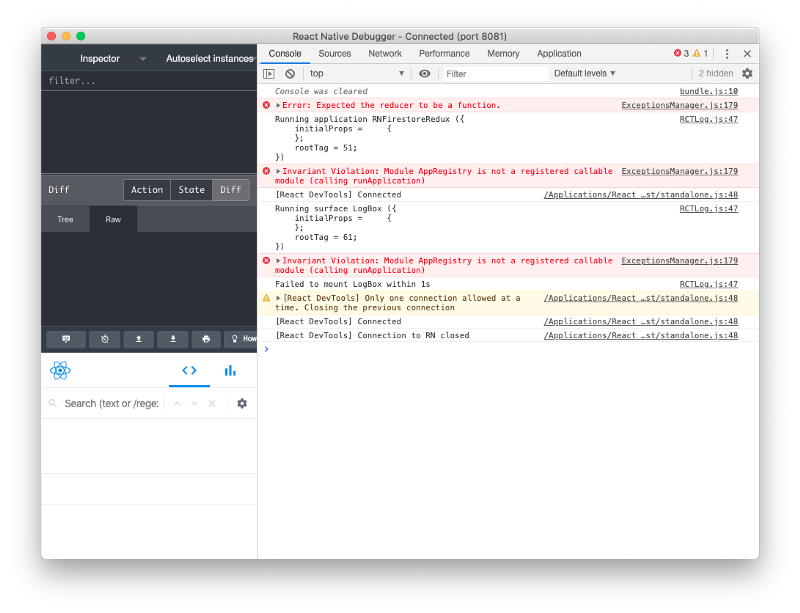
Once the app is in the debug mode, with the React Native Debugger already opened, you will notice that the app connects to the React Native Debugger instead of the Chrome Dev Tools. All the console logs and debugging options will appear in the debugger app as shown in the screenshot below:
一旦应用程序进入调试模式,并且已打开React Native Debugger,您将注意到该应用程序连接到React Native Debugger而不是Chrome开发工具。 所有控制台日志和调试选项将显示在调试器应用程序中,如以下屏幕截图所示:
Now, as we have learned about the installation and use cases, we are ready to use this Debugger app.
现在,当我们了解了安装和用例之后,就可以使用此调试器应用程序了。
Chrome开发工具,React开发工具,Redux开发工具 (Chrome Dev Tools, React Dev Tools, Redux Dev tools)
As you can notice, all these above important debugging extensions are under a single window. One benefit is that the app window size does not need to be full screen. Hence, we can use the debugger adjacently with the emulator as shown in the screenshot below:
如您所见,所有以上所有重要的调试扩展都在一个窗口下。
 最低0.47元/天 解锁文章


 6721
6721


 被折叠的 条评论
为什么被折叠?
被折叠的 条评论
为什么被折叠?
 到【灌水乐园】发言


