


应用架构与基础架构
Do you have an app out in the wild? Maybe you are working on one right now. Whichever the case may be, you want to be able to measure the performance of your app.
您是否有野外的应用程序? 也许您现在正在研究一个。 无论哪种情况,您都希望能够评估应用程序的性能。
您的应用程序表现如何? (How is your app performing?)
This is a deceptively complicated question. There are so many directions you can go with your answer. By the end of this article, there should be a clear path to answering all the following questions:
这是一个看似复杂的问题。 您可以选择答案的方向很多。 在本文末尾,应该有一条明确的道路来回答以下所有问题:
- How many users are using your app this month? 本月有多少用户在使用您的应用?
- What is the user retention rate for over 3 days? 3天以上的用户保留率是多少?
- How much money did the app generate in the last 7 days? 该应用在过去7天内产生了多少钱?
- How long is the app startup for the 99th percentile of users? 应用程序启动对99%的用户有多长时间?
- Which endpoints are slow? 哪些端点速度慢?
- What are the biggest crashes in the app for a specific release? 特定版本的应用程序中最大的崩溃是什么?
- Have any users ended up in an unexpected state? 是否有任何用户最终处于意外状态?
We will answer these questions through four categories:
我们将通过四个类别回答这些问题:
- Use Behavior Analytics 使用行为分析
- Developer-oriented Logging 面向开发人员的日志记录
- Application Performance Management 应用性能管理
- Feature Toggles 功能切换
快速可靠的解决方案 (A Quick and Reliable Solution)

To help us collect and measure our data, we will rely on third-party services to make our lives easier. Google Firebase provides a set of comprehensive tools and services that will help us achieve better app infrastructure.
为了帮助我们收集和衡量数据,我们将依靠第三方服务来简化生活。 Google Firebase提供了一套全面的工具和服务,可帮助我们实现更好的应用程序基础架构。
Why Choose Firebase?
为什么选择Firebase?
- Lots of great features 很多很棒的功能
- Easy-to-use dashboards 易于使用的仪表板
- Amazing documentation 惊人的文档
- Up-to-date code examples 最新的代码示例
- Free-tier plan 免费套餐
There are plenty of alternatives. Firebase is one of the options we can pick. All the code samples in this article will be referring to Firebase in Kotlin.
有很多选择。 Firebase是我们可以选择的选项之一。 本文中的所有代码示例都将引用Kotlin中的Firebase。
用户行为分析 (User Behavior Analytics)

You won’t be successful if you don’t understand how users are using your app. Good thing there are plenty of solutions for user-behavior analytics tracking. With most services, Firebase included, a few lines of configuration code will provide all the following information:
如果您不了解用户如何使用您的应用程序,您将不会成功。 好的事情是,有很多用于用户行为分析跟踪的解决方案。 对于大多数服务(包括Firebase),几行配置代码将提供以下所有信息:
- Daily active users 每日活跃用户
- Monthly active users 每月活跃用户
- Average session times 平均会话时间
- User locality 用户所在地
- Device information 设备信息
- Engagement score 参与度得分
With a little more work, you can integrate additional tracking for things like:
通过更多工作,您可以集成其他跟踪功能,例如:
- User experience funnel 用户体验渠道
- Custom user properties 自定义用户属性
- Custom metrics 自定义指标
- Purchases/conversion metrics 购买/转化指标
记录事件 (Logging Events)
Firebase provides a set of common events you can use. The example below represents tracking when a user clicks on an image from a collection view of posts.
Firebase提供了一组可以使用的常见事件 。 下面的示例表示跟踪用户何时从帖子的集合视图中单击图像。
firebaseAnalytics.logEvent(FirebaseAnalytics.Event.SELECT_ITEM) {
    param(FirebaseAnalytics.Param.ITEM_ID, postId)
    param(FirebaseAnalytics.Param.ITEM_NAME, postName)
    param(FirebaseAnalytics.Param.CONTENT_TYPE, "image")
}
If you have use-cases outside of the event types provided by Firebase, you can always send a custom event.
如果您有Firebase提供的事件类型以外的用例,则始终可以发送自定义事件。
firebaseAnalytics.logEvent("share_image") {
    param("image_name", name)
    param("full_text", text)
}
The skies the limits here on what you want to track. Collaborate with your analyst. Be sure to consider your user’s privacy and local regulations.
这里的天空限制了您要跟踪的内容。 与您的分析师合作。 确保考虑用户的隐私和当地法规。
面向开发人员的日志记录 (Developer-oriented Logging)
On the other end of logging, we have metrics that are more developer-oriented. The distinction becomes a little bit more clear when you think about who the data is for.
在日志记录的另一端,我们的指标更面向开发人员。 当您考虑数据的来源时,区别会变得更加清晰。
Crash and exception reporting are examples of developer-oriented metrics.
崩溃和异常报告是面向开发人员的指标的示例。
崩溃报告 (Crash Reporting)
It is important to have a way of tracking crashes that happen out in production. Crashes lead to poor user experiences that will translate to bad reviews, less revenue, and users leaving the app.
重要的是要有一种跟踪生产中发生的崩溃的方法。 崩溃导致不良的用户体验,这将导致不良评论,收入减少以及用户离开应用程序。
Crashyltics has a very simple setup process and will automatically report crashes & related metrics back to the Firebase dashboard.
Crashyltics的安装过程非常简单,它将崩溃和相关指标自动报告回Firebase仪表板。
Don’t forget to set up alerts so you can stay informed in real-time when things go wrong.
不要忘记设置警报,以便在出现问题时可以实时了解情况。
异常报告 (Exception Reporting)
Exceptions are thrown when the code reaches a scenario with unexpected behavior. NullPointerException, IllegalStateException, or IllegalArgumentException are examples of such scenarios. Unlike crashes, we can catch exceptions and return the user to a stable state. We want to report these as well as any other thrown exceptions.
当代码到达具有意外行为的方案时,将引发异常。 NullPointerException , IllegalStateException或IllegalArgumentException是此类方案的示例。 与崩溃不同,我们可以捕获异常并使用户返回稳定状态。 我们要报告这些以及任何其他引发的异常。
Firebase does a great job providing a simple API to record exceptions.
Firebase在提供简单的API记录异常方面做得很好。
try {
    methodThatThrows();
} catch (Exception e) {
    FirebaseCrashlytics.getInstance().recordException(e);
    // ...handle the exception.
}
A good place to start logging these scenarios is the networking layer. There are plenty of opportunities with HTTP and connection errors.
开始记录这些方案的好地方是网络层。 HTTP和连接错误有很多机会。
其他日志 (Additional Logs)
You can add additional logs to give crashes or exceptions more context. I would add additional logs is if I was going to do something that has a higher likelihood to fail.
您可以添加其他日志来为崩溃或异常提供更多上下文。 我要添加其他日志是,如果我要做某事更有可能失败。
If I was going to fetch an 8mb image, I would add this log to give context for any potential HTTP or network errors.
如果要获取一个8mb的图像,我将添加此日志以为任何潜在的HTTP或网络错误提供上下文。
FirebaseCrashlytics.getInstance().log("Fetching large image")应用性能管理 (Application Performance Management)
Application performance management(APM) provides a set of tools that monitors the performance of your application. One key concept of tracking performance is the use of traces. Traces record the start and stop of an event.
应用程序性能管理(APM)提供了一组监视应用程序性能的工具。 跟踪性能的一个关键概念是跟踪的使用。 跟踪记录事件的开始和结束。
Integrating with Firebase’s Performance Monitoring service will provide a set of automatic traces like…
与Firebase的Performance Monitoring服务集成后,将提供一组自动跟踪,例如…
- App startup duration 应用启动时间
- App in foreground/background performance 应用程序的前台/后台性能
- Network traces that record success rate, response time, and payload size 记录成功率,响应时间和有效负载大小的网络跟踪
- Screens that have low frames-per-second 每秒帧数较低的屏幕
自定义痕迹 (Custom Traces)
Adding custom traces is key to being data-driven. Here are a few examples of custom traces you should implement.
添加自定义跟踪是数据驱动的关键。 这是您应该实现的自定义跟踪的一些示例。
- Library initialization times 库初始化时间
- Retrieving data from the disk cache 从磁盘缓存中检索数据
- Long-processing tasks 长时间处理的任务
I would say a rule of thumb for when to implement a custom trace is when the duration of any task takes more than 10ms.
我想说何时实施自定义跟踪的经验法则是,任何任务的持续时间超过10ms。
自定义跟踪示例 (Custom Trace Example)
val myTrace = FirebasePerformance.getInstance().newTrace("deserialize_item_feed")
myTrace.start()// take the item feed response and deserialize them into data modelsmyTrace.stop()
If we want to track the duration of retrieving data, we will need to measure the time it takes to get the data as well as how long it will take to map the information into a consumable format.
如果要跟踪检索数据的持续时间,则需要测量获取数据所花费的时间以及将信息映射为可消耗格式所花费的时间。
Firebase provides support for tracking network request durations. We can combine that information with a deserialization trace to understand how long it takes for data to be available to use.
Firebase支持跟踪网络请求持续时间。 我们可以将该信息与反序列化跟踪结合起来,以了解可使用数据的时间。
性能数据 (Performance Data)
Implementing an APM will help you understand exactly which external service, component, or code block is slow.
实施APM将帮助您准确了解哪个外部服务,组件或代码块运行缓慢。
- How fast are the backend requests? 后端请求有多快?
- Are we doing things we shouldn’t be on the main thread? 我们在做我们不应该在主线程上的事情吗?
- Does loading an intricate animation cause the device to skip frames? 加载复杂的动画是否会导致设备跳过帧?
This is the tip of the iceberg of things we can be data-driven with. Explore the various opportunities in your app.
这是我们可以进行数据驱动的事物的冰山一角。 探索应用程序中的各种机会。
功能切换 (Feature Toggles)
Enable and disable features in real-time with Firebase Remote Config. There are plenty of use cases for this feature such as
使用Firebase Remote Config实时启用和禁用功能。 此功能有很多用例,例如
- A/B Testing A / B测试
- Launch new features with percentage roll-out 通过百分比推出启动新功能
- Define properties based on platform/locale/user-segment 根据平台/语言环境/用户细分定义属性
- Disabling an unstable feature 禁用不稳定的功能
- Locking paid features to free users 将付费功能锁定给免费用户
The general implementation flow is defining default values, fetching the latest configuration, and responding to the updated configuration.
一般的实现流程是定义默认值,获取最新配置并响应更新后的配置。
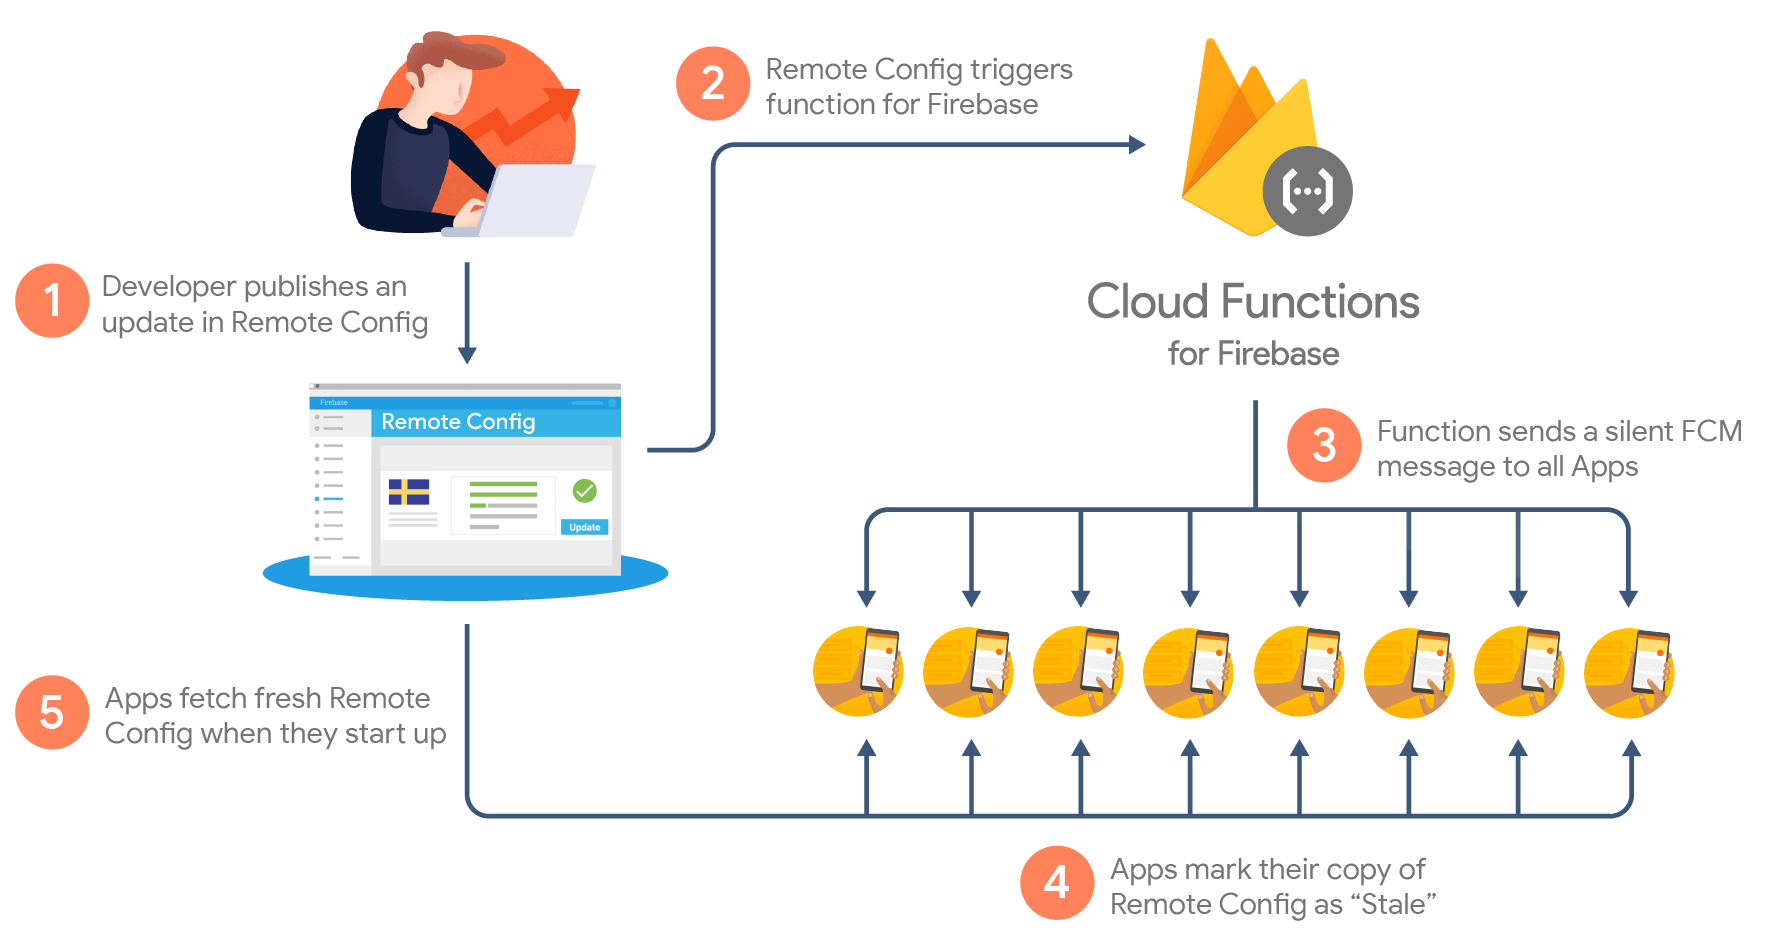
To support real-time configuration updates, here’s a nifty diagram outlining the steps.
为了支持实时配置更新,这是一个精巧的图表,概述了这些步骤。
注意事项 (Considerations)
One of Firebase’s limitations is that they keep data as far back as 90 days for their dashboards. There is support for exporting the entire history into another data warehouse. There may be a point where keeping historical data of your app’s performance is worth the cost. Keep this in mind as your app grows.
Firebase的局限性之一是它们可以将仪表板的数据保留多达90天。 支持将整个历史记录导出到另一个数据仓库中。 在某些情况下,保留应用程序性能的历史数据值得付出代价。 随着应用的增长,请记住这一点。
结论 (Conclusion)
It is no secret that technology does not scale without proper infrastructure. The ability to scale is useless if we do not have the data to guide us in the right direction. The challenge we have now is to invest in infrastructure and be data-driven in our approach.
没有适当的基础架构,技术就无法扩展,这已不是什么秘密。 如果我们没有数据来引导我们朝着正确的方向发展,那么扩展能力就毫无用处。 现在,我们面临的挑战是在基础架构上进行投资并采用数据驱动的方法。
This isn’t an exhaustive list but it’s a great introduction to various ways of leveling up your app. It will also enable you and your business to be more data-driven.
这不是一个详尽的列表,而是对升级应用程序的各种方式的很好的介绍。 它还将使您和您的企业变得更加以数据为导向。
I wish you all the best in building better apps and better businesses.
祝您在建立更好的应用程序和更好的业务方面一切顺利。
翻译自: https://medium.com/@johnleeroy/level-up-your-app-infrastructure-8040057f6235
应用架构与基础架构


 145
145

 被折叠的 条评论
为什么被折叠?
被折叠的 条评论
为什么被折叠?
 到【灌水乐园】发言


