


这是因为,oracle数据库实例作为一个操作系统用户始终需要使用操作系统提供的函数来给这些时间指标 DB TIME /DB CPU/ CPU TIME 测时, 而我们也说过 “自我观察总是容易出现问题”,例如自己给自己的短跑计时,那么可能总是不太准确。
其次由于不同的操作系统上不同的系统函数的表现不一样也会有区别。
对于CPU TIME 一般使用 getrusage() 函数来计时,该函数的粒度为10,000(10*1000) msec。
对于DB TIME 则会使用gettimeofday() 函数以外部计时的形式来计时。
在AIX 上存在
Bug 13846587 AIX: Unrealistic CPU Time / DB time with 11.2.0.3 for IBM AIX
This problem is introduced in 11.2.0.3 on AIX systems by the change from
This is an issue where the value of a CPU time related statistics such as
the DB time in an AWR or the Execute CPU time in a TKPROF shows an
enlarged value in the scale of E11 seconds.
Note:
There is also an AIX problem in that thread_cputime() may return an incorrect value in some
cases, leading to incorrect/unexpected DB CPU figures in Oracle - see Note:1631769.1.
Following is complete messahe Customer given regarding to that :
===================================================================
We had a ticket and a call with IBM on Friday. IBM confirms that vac.cfg.61
file delivered in their C++ compiler which is a separate package from the
runtime compiler that comes by default with the OS upgrade. Our OS runtime
compiler is 11.1.0.2 that is the latest and the greatest delivered with IBM
AIX 6.1 version.
Therefore I confirm that we will not have or not able to get vac.cfg.61 file
because (1) having compiler on the production server is against Bank of
America IT policies (2) We do not have license for the compiler.
What am I expecting from Oracle? I am expecting Oracle to resolve this issue
where patch installs on our database w/o any installation issues. This is SEV
1 issue and I will really appreciate if this issue is resolved ASAP.
RELEASE NOTES:
]]If the value of a cpu time related statistics such as the DB time in an AWR o
]]r the Execute cpu time in a TKPROF shows an enlarged value in the scale of E1
]]1 seconds, then apply this patch to correct the problem.
REDISCOVERY INFORMATION:
An AWR report shows enlarged (E11 secs) "DB time" values.
A TKPROF report shows enlarged (E11 secs) Execute cpu time.
WORKAROUND:
Bug 7445289 – DB time reported too high when there are a lot of direct path reads (Doc ID 7445289.8)
Affects:
Product (Component)
Oracle Server (Rdbms)
Range of versions believed to be affected
Versions BELOW 11.2
Versions confirmed as being affected
(None Specified)
Platforms affected
Generic (all / most platforms affected)
Fixed:
Description
DB time shown in AWR report's Time Model section can be higher than
the actual value when there are a large number of direct path wait
events with small (<1ms) avg wait time.
eg: When waiting on "direct path read" there may be some element
of CPU time included in the wait time.
Hence adding DB CPU time to time in non-idle wait time to get
a DB time figure can give an over high figure due to double
counting of any CPU time used during the wait itself.
Note:
This is only a problem in the reporting of the DB time.
Workaround
Infer DB time from ASH report. time_period * avg_active_sessions
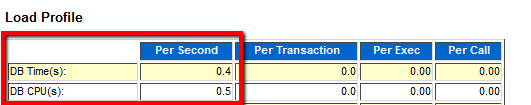
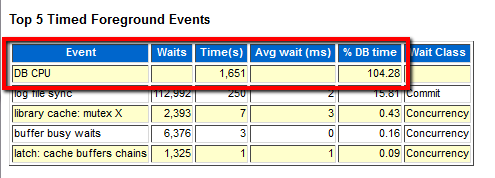
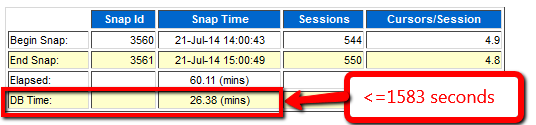
In some AWR reports, the db cpu is larger than db time for example:
DB Time:
The issue can also be verified by 10046 trace:
SQL> alter session set events '10046 trace name context forever, level 12';
DECLARE
ABC DATE;
BEGIN
FOR I IN 1 .. 10000 LOOP
SELECT SYSDATE INTO ABC FROM DUAL;
END LOOP;
END;
/
SQL> alter session set events '10046 trace name context off';
On checking the trace:
********************************************************************************
SQL ID: c749bc43qqfz3 Plan Hash: 1388734953
SELECT SYSDATE
FROM
DUAL
call count cpu elapsed disk query current rows
------- ------ -------- ---------- ---------- ---------- ---------- ----------
Parse 1 0.00 0.00 0 0 0 0
Execute 10000 0.38 0.37 0 0 0 0
Fetch 10000 0.08 0.10 0 0 0 10000
------- ------ -------- ---------- ---------- ---------- ---------- ----------
total 20001 0.46 0.48 0 0 0 10000
Misses in library cache during parse: 1
Optimizer mode: ALL_ROWS
Parsing user id: SYS (recursive depth: 1)
Number of plan statistics captured: 1
Rows (1st) Rows (avg) Rows (max) Row Source Operation
---------- ---------- ---------- ---------------------------------------------------
1 1 1 FAST DUAL (cr=0 pr=0 pw=0 time=3 us cost=2 size=0 card=1)
********************************************************************************
CHANGES
None
CAUSE
The issue is that CPU time and DB time are measured by different C routines.
The CPU time uses the getrusage() call which has a granularity of 10,000(10*1000) msec.
The DB Time uses the gettimeofday() call using the external operating system clocks which has no such issue.
I.e. getrusage() can measure only 0 or N*1000 microsec (N = 1,2,…) for a FETCH call but the real elapsed time may be somewhere in between the 2 values.
This means that getrusage tends to overestimate the CPU time so you can see a slightly higher value of “DB CPU” than “DB Time” especially when thousands of roundings are involved.
This is not a bug but development commented upon this in the following bugs:
Bug 19266484 awr reports db cpu greater than db time
Bug 16241074 awr shows wrong cpu information for some sqls when hyperthreading is enabled
Bug 19234247 incorrect cpu reported in awr report for sqls
SOLUTION
This is a reporting issue as opposed to an actual problem. Since the variance is likely to be low, the differences can be ignored.
REFERENCES
BUG:16241074 – AWR SHOWS WRONG CPU INFORMATION FOR SOME SQLS WHEN HYPERTHREADING IS ENABLED
BUG:19234247 – INCORRECT CPU REPORTED IN AWR REPORT FOR SQLS
BUG:19266484 – AWR REPORT DB CPU GREATER THAN DB TIME


 1308
1308


 被折叠的 条评论
为什么被折叠?
被折叠的 条评论
为什么被折叠?
 到【灌水乐园】发言


