


 该博客介绍了如何使用MATLAB生成轮廓图以分析聚类数据。通过生成随机样本数据并使用kmeans进行两聚类,展示了使用默认的平方欧几里得距离和欧几里得距离两种情况下的轮廓图。结果表明,两种情况下数据都分为大小相等的两个聚类,并且所有点的轮廓值较大,意味着聚类分离良好。
Create silhouette plots from clustered data using different distance metrics.
Generate random sample data.
rng('default') % For reproducibility
X = [randn(10,2)+3;randn(10,2)-3];
Create a scatter plot of the data.
scatter(X(:,1),X(:,2));
title('Randomly Generated Data');
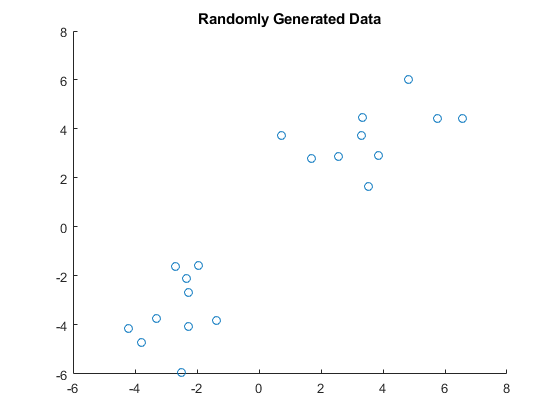
The scatter plot shows that the data appears to be split into two clusters of equal size.
Partition the data into two clusters using kmeans with the default squared Euclidean distance metric.
clust = kmeans(X,2);
clust contains the cluster indices of the data.
Create a silhouette plot from the clustered data using the default squared Euclidean distance metric.
silhouette(X,clust)
 最低0.47元/天 解锁文章


 3297
3297

 被折叠的 条评论
为什么被折叠?
被折叠的 条评论
为什么被折叠?
 到【灌水乐园】发言


