


Tideways扩展能把每条请求生成详细的执行日志,通过Toolkit对日志分析就能清楚的获取到函数、CPU的调用时长等等
安装 Tideways
先来说一下如何安装Tideways扩展,这里应该是tideways_xhprof扩展
因为新发布的5.0版本对原始XHProf扩展进行了完整现代化的开源重写,具有新的核心数据结构,并专门针对PHP7进行了优化
此扩展要求PHP >= 7.0,低版本还是使用Tideways,考虑性能还是升级PHP7吧
使用源代码进行编译安装
git clone https://github.com/tideways/php-xhprof-extension.git
cd php-profiler-extension
phpize
./configure
make && make install
编译完成后在php.ini中加入
extension=tideways_xhprof.so
然后重启Apache或者php-fpm,cli模式下可以直接使用php --ri tideways_xhprof查看是否安装成功
安装 Toolkit
Toolkit是Tideway官方提供的性能分析的命令行工具
建议使用每个发行版本提供的对应的二进制来进行安装Toolkit:releases
如果你想使用源代码进行构建,Toolkit是用Go编写的,你可以用Go编译器安装
go get github.com/tideways/toolkit
安装完成后使用tk命令查看是否安装成功
[root@sy-test ~]# tk
The Tideways Toolkit (tk) is a collection of commandline tools to interact with
PHP and perform various debugging, profiling and introspection jobs by
interacting with PHP or with debugging extensions for PHP.
Are you looking for a production profiler for your team with Web UI, SQL and
HTTP profiling, monitoring, exception tracking and more?
Start a Tideways Profiler 30 days trial @ https://tideways.io
Usage:
tk [command]
Available Commands:
analyze-callgrind Parse the output of callgrind outputs into a sorted tabular output.
analyze-xhprof Parse the output of JSON serialized XHProf outputs into a sorted tabular output.
compare-callgrind Compare two callgrind outputs and display them in a sorted table.
compare-xhprof Compare two JSON serialized XHProf outputs and display them in a sorted table.
generate-xhprof-diff-graphviz Parse the output of two JSON serialized XHProf outputs, and generate a dot script out of their diff.
generate-xhprof-graphviz Parse the output of JSON serialized XHProf outputs into a dot script for graphviz.
help Help about any command
Flags:
-h, --help help for tk
Use "tk [command] --help" for more information about a command.
使用
安装完成后当然是要来使用的,在你的代码中进行埋点处理
if (extension_loaded('tideways_xhprof')) {
tideways_xhprof_enable(TIDEWAYS_XHPROF_FLAGS_CPU | TIDEWAYS_XHPROF_FLAGS_MEMORY);
}
// 你的代码
application();
if (extension_loaded('tideways_xhprof')) {
$data = tideways_xhprof_disable();
file_put_contents(
sprintf('%s/app.xhprof', '/path/to'),
json_encode($data)
);
}
执行下代码,在对应目录下就会生成xphrof的日志文件,然后我们进行分析
性能分析
性能分析就要使用到我们刚才安装过到Toolkit,在命令行使用命令
tk analyze-xhprof /path/to/app.xphrof
就可以看到这样子的数据:
Showing XHProf data by Exclusive Wall-Time
+----------------+-------+-----------+------------------------------+
| FUNCTION | COUNT | WALL-TIME | EXCL WALL-TIME (>= 0 02 MS) |
+----------------+-------+-----------+------------------------------+
| Redis::connect | 1 | 0.16 ms | 0.16 ms |
| Redis::set | 1 | 0.16 ms | 0.16 ms |
| Redis::get | 1 | 0.06 ms | 0.06 ms |
| main() | 1 | 0.46 ms | 0.04 ms |
| var_dump | 1 | 0.02 ms | 0.02 ms |
+----------------+-------+-----------+------------------------------+
Looking for a Web UI and SQL Profiling Support? Try our SaaS: https://tideways.io
默认性能分析的指标是wt_excl,其他的指标有
wt 调用时长,包括子函数
excl_wt 调用时长,不包括子函数
cpu CPU调用时长,包括子函数
excl_cpu CPU调用时长,不包括子函数
memory 内存消耗(字节),包括子函数
excl_memory 内存消耗(字节),不包括子函数
io io时长,包括子函数
excl_io io时长,不包括子函数
生成性能瓶颈图
我们需要使用dot生成对应到图,所以需要安装graphviz
# macOS
brew install graphviz
# ubuntu
sudo apt-get install -y graphviz
# centos
sudo yum install -y graphviz
安装成功之后就可以开始搞了,使用命令
# 生成dot文件
tk generate-xhprof-graphviz /path/to/app.xhprof
# 将dot文件处理成图片
dot -Tpng callgraph.dot > callgraph.png
目录下的callgraph.png就是生成的性能瓶颈图
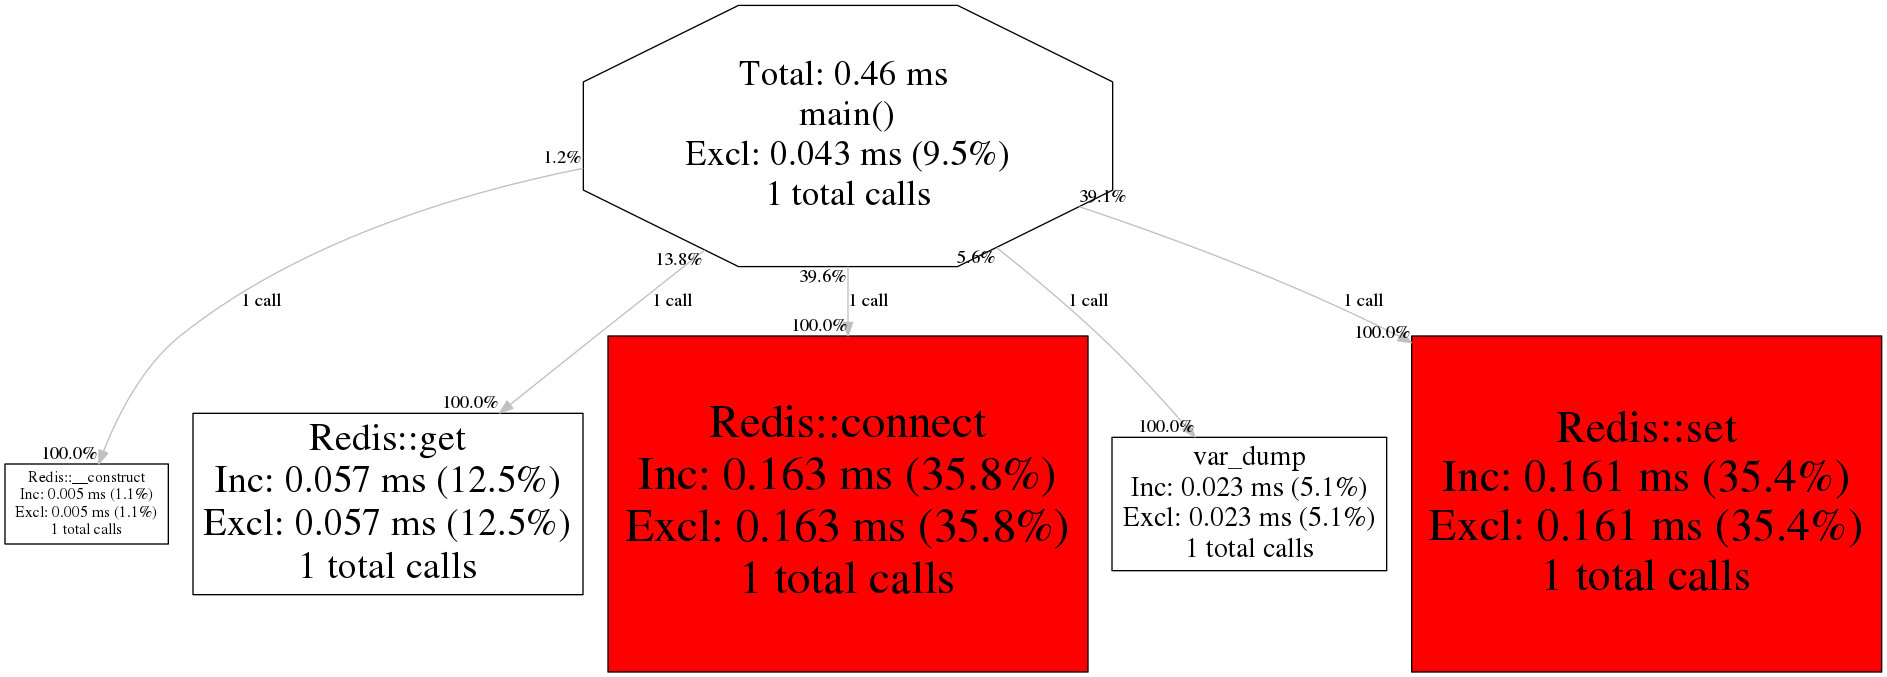
图中会指出:函数;Inc函数运行时间,包括子函数;Excl函数运行时间,不包括子函数;total calls总调用次数;


 210
210


 被折叠的 条评论
为什么被折叠?
被折叠的 条评论
为什么被折叠?
 到【灌水乐园】发言


