


1. 使用polygon进行纯色填充
# polygon函数介绍
polygon(x, y = NULL, density = NULL, angle = 45,
border = NULL, col = NA, lty = par("lty"),
..., fillOddEven = FALSE)
其中density为填充的阴影线的密度,angle为阴影线的斜率(角度)。值得注意的是,当你需要纯色填充时,density和angle可以忽略不写。然后border为边框的颜色。同时border也可以是逻辑。即FALSE相当于NULL,TRUE相当于为前景色。
# Distance Between Brownian Motions 布朗运动之间的距离
n
xx
yy
plot (xx, yy, type = "n", xlab = "Time", ylab = "Distance")
polygon(xx, yy, col = "gray", border = "red")
title("布朗运动之间的距离")
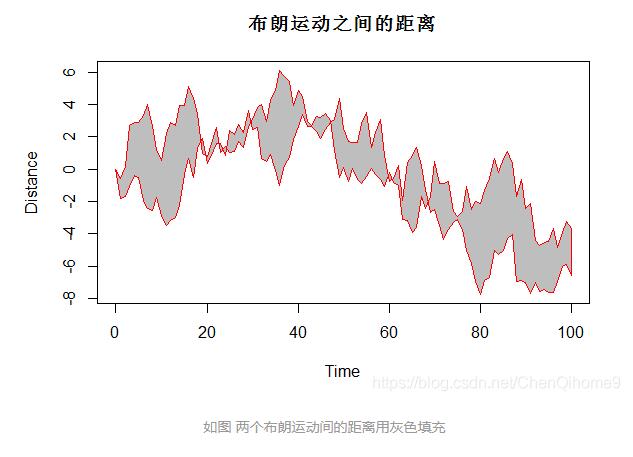
如图 两个布朗运动间的距离用灰色填充
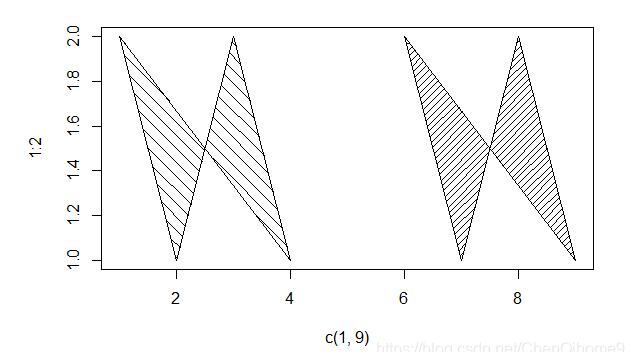
2. 使用polygon进行阴影线填充
# Line-shaded polygons 线阴影多边形
plot(c(1, 9), 1:2, type = "n")
polygon(1:9, c(2,1,2,1,NA,2,1,2,1),
density = c(10, 20), angle = c(-45, 45)) #density的值为两个,即不同的密度
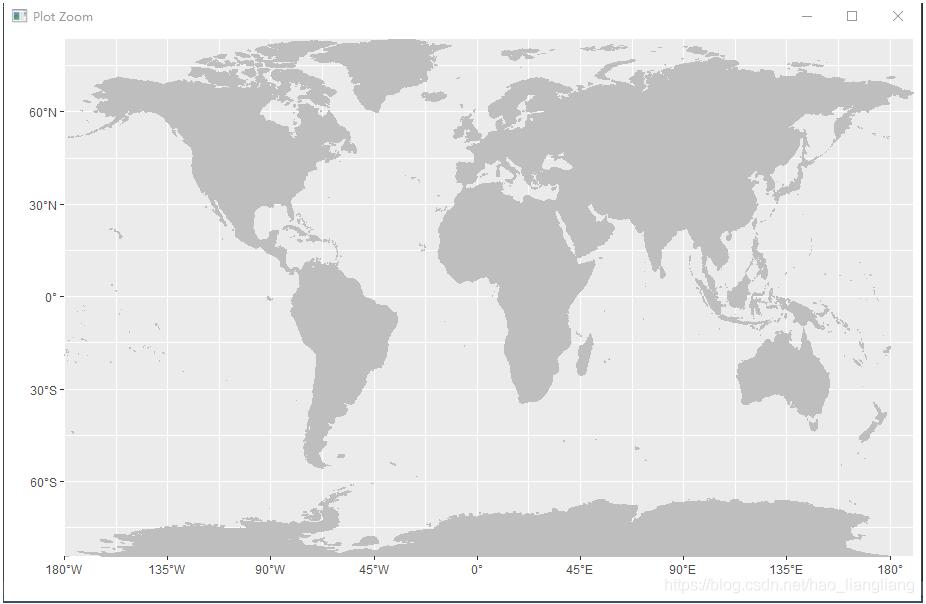
补充:R语言世界地图转为SpatialPolygons以及去除地图内国家边界
##加载包
library(maps)
library(maptools)
library(ggplot2)
library(metR)
##提取地图并转换为Spatialpolygons
loc
plot = FALSE, fill = TRUE,col = 'transparent')
ids
loc
##去除内边界
worldmap1
##画图
worldmap2
ggplot()+
scale_x_longitude(expand = c(0, 0), breaks = seq(-180, 180, 45))+
scale_y_latitude(expand = c(0, 0), breaks = seq(-90, 90, 30))+
geom_polygon(data = worldmap2,
mapping = aes(x = long, y = lat, group = group),
colour = 'gray', fill = 'gray', size = 0.5)
##结果图
以上为个人经验,希望能给大家一个参考,也希望大家多多支持脚本之家。如有错误或未考虑完全的地方,望不吝赐教。


 4241
4241


 被折叠的 条评论
为什么被折叠?
被折叠的 条评论
为什么被折叠?
 到【灌水乐园】发言


