


Highcharts官网
基本柱图
<!DOCTYPE html>
<html>
<head>
<title>我的柱</title>
<script type="text/javascript" src="http://ajax.googleapis.com/ajax/libs/jquery/1.8.2/jquery.min.js"></script>
<script src="js/highcharts.js"></script>
<script src="js/exporting.js"></script>
</head>
<body>
<script type="text/javascript">
$(function () {
$('#container').highcharts({
chart: {
type: 'column'
},
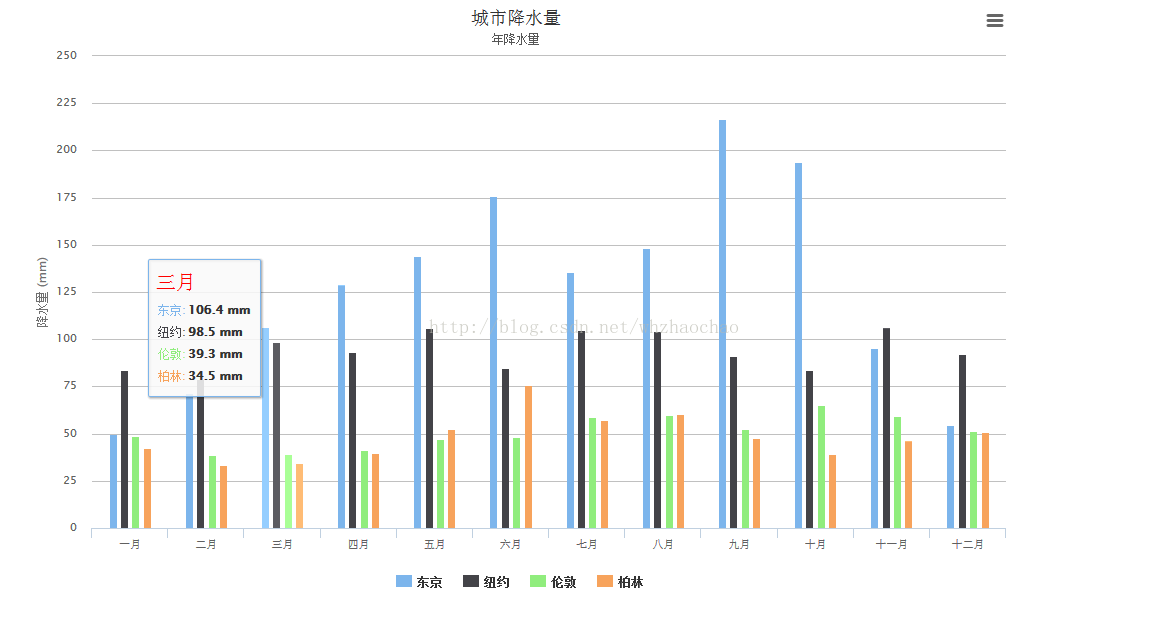
title: {
text: '城市降水量'
},
subtitle: {
text: '年降水量'
},
xAxis: {
categories: [
'一月',
'二月',
'三月',
'四月',
'五月',
'六月',
'七月',
'八月',
'九月',
'十月',
'十一月',
'十二月'
]
},
yAxis: {
min: 0,
title: {
text: '降水量 (mm)'
}
},
tooltip: {
headerFormat: '<span style="font-size:20px;color:red">{point.key}</span><table>',
pointFormat: '<tr><td style="color:{series.color};padding:0">{series.name}: </td>' +
'<td style="padding:0"><b>{point.y:.1f} mm</b></td></tr>',
footerFormat: '</table>',
shared: true,
useHTML: true
},
plotOptions: {
column: {
pointPadding: 0.2,
borderWidth: 0
}
},
series: [{
name: '东京',
data: [49.9, 71.5, 106.4, 129.2, 144.0, 176.0, 135.6, 148.5, 216.4, 194.1, 95.6, 54.4]
}, {
name: '纽约',
data: [83.6, 78.8, 98.5, 93.4, 106.0, 84.5, 105.0, 104.3, 91.2, 83.5, 106.6, 92.3]
}, {
name: '伦敦',
data: [48.9, 38.8, 39.3, 41.4, 47.0, 48.3, 59.0, 59.6, 52.4, 65.2, 59.3, 51.2]
}, {
name: '柏林',
data: [42.4, 33.2, 34.5, 39.7, 52.6, 75.5, 57.4, 60.4, 47.6, 39.1, 46.8, 51.1]
}]
});
});
</script>
<div id="container" style="width: 1000px; height: 600px; margin: 0 auto"></div>
</body>
</html>- 1.
- 2.
- 3.
- 4.
- 5.
- 6.
- 7.
- 8.
- 9.
- 10.
- 11.
- 12.
- 13.
- 14.
- 15.
- 16.
- 17.
- 18.
- 19.
- 20.
- 21.
- 22.
- 23.
- 24.
- 25.
- 26.
- 27.
- 28.
- 29.
- 30.
- 31.
- 32.
- 33.
- 34.
- 35.
- 36.
- 37.
- 38.
- 39.
- 40.
- 41.
- 42.
- 43.
- 44.
- 45.
- 46.
- 47.
- 48.
- 49.
- 50.
- 51.
- 52.
- 53.
- 54.
- 55.
- 56.
- 57.
- 58.
- 59.
- 60.
- 61.
- 62.
- 63.
- 64.
- 65.
- 66.
- 67.
- 68.
- 69.
- 70.
- 71.
- 72.
- 73.
- 74.
- 75.
- 76.
- 77.
- 78.
- 79.
- 80.
- 81.
- 82.
- 83.
- 84.
- 85.
- 86.
- 87.
- 88.
- 89.
效果


 210
210

 被折叠的 条评论
为什么被折叠?
被折叠的 条评论
为什么被折叠?
 到【灌水乐园】发言


