


Images not loading on my old Android phone?
While working on a React Native app not long ago, I noticed something odd. I could not see any images on the next screens, only colors and text on Android. Whereas, there was no problem on iOS.
I blamed my old Android phone which I had recently set up for testing React Native Android projects. I went so far as to install a custom rom (based on AOSP 5.1.1) for running React Native on a higher Android version, and to get rid of all the useless Samsung apps. However, I couldn’t see any images except on the first screen of a sample project. I just threw the phone back in my drawer.
A couple of days later, my friend posted that images were not loading on a certain screen of a React Native Android app. Hmm… that’s pretty bizarre… oh wait, I think I have seen something like that…
Oh, it was not just my phone.
It’s… hard to explain.
The source code is straightforward. There are no tricks or external libraries for displaying images. I started off by running the app on GenyMotion and Android Virtual Device(AVD) with different Android versions:
My phone: I could only see the images that were on the first screen
GenyMotion (API 21, API 22): Problem with some
 nodes
nodes
AVD (API 21, API 22, API 23): No problem!?
I thought the chances are that the issue was only happening on specific devices or Android API versions but apparently it wasn’t. In another words, I had to take pretty much all the other possibilities into account. This was becoming a big headache.
My life-long enemy: memory
This app has many images to display as cell backgrounds and they aren’t small. (400~800kb) Despite that, it should be bearable, but one thing slightly suspicious was that the images are fetched by remote URI.
I started wondering what the memory structure looked like, especially heap space since the images from remote will be assigned dynamically. I started tracking down memory usage.
You want some eye-candy memory inspector?
Years ago, I used to use this to check memory usage:
adb shell dumpsys meminfo复制代码
I love console applications, but this is not so eye-friendly when it comes to visualizing memory usage.

You don’t want these, do you?
If you use it when you’re hungover on a Saturday morning, it’s a nightmare. (Not that I did, though
 ) I needed something to make running the garbage collector easy.
The easiest (and free!) inspector is Android Device Monitor. If you have Android Studio, you already have it. Open it up with these steps:
Run React Native app normally (react-native run-android)
Run Android Studio
On the menu, click Tools → Android → Enable ADB Integration
Click Tools → Android → Android Device Monitor
When Android Device Monitor shows up, click Monitor → Preferences
On the dialog, in Android →DDMS, check these two options:
Heap updates enabled by default
Thread updates enable by default (optional)
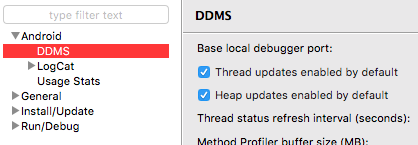
Then you will see a screen like this (System Information tab):

If you see this screen:

Run this to make your development server accessible for the device.
adb reverse tcp:8081 tcp:8081复制代码
This could happen if you run your app from Android Studio while the app has already been started by react-native run-android.
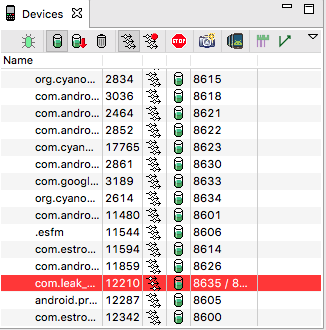
Select your app on the Devices tab on the left. Now you’re ready to check out your app’s memory.
Increase the heap size
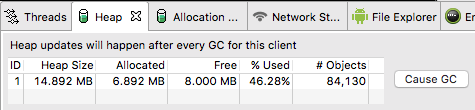
I saw something weird was going on while I was running Android Device Monitor and navigating through the screens.
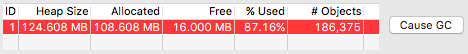
It was the Heap Size which wasn’t going over about 124MB, even though it was already about 124MB on the first screen. Then garbage collector ran:
I/art(27035): Background partial concurrent mark sweep GC freed 1584(69KB) AllocSpace objects, 2(30KB) LOS objects, 12% free, 108MB/124MB, paused 3.874ms total 182.718ms复制代码
My question was, “Why is the heap size so small?”
Recommendeddalvik.vm.heapsize in ART Java Heap Parameter for Android 5.0.0 is 384MB:
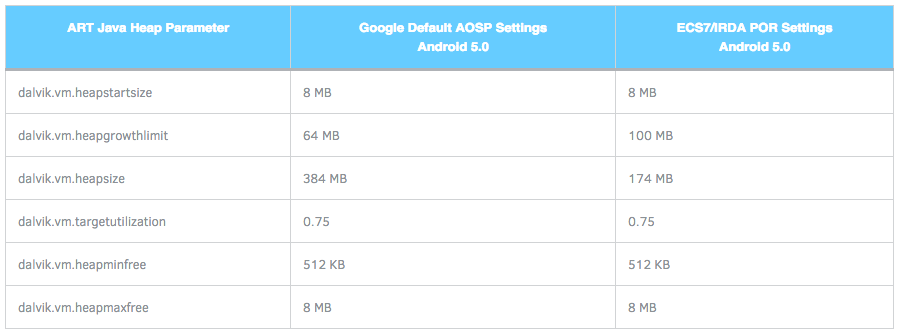
I even pulled my phone’s build property and checked (adb -d pull /system/build.prop) the heap size was 256MB.

Then I figured out how to set a larger heap size. Just add this line in: in AndroidManifest.xml
@string/app_name"
android:icon="@mipmap/ic_launcher"
android:theme="@style/AppTheme"
android:largeHeap="true">复制代码
This is the result when I enabled largeHeap:

That’s it. Yes. Only one dang line. What a bummer!
The reason that none of AVD instances (API 21 ~23) have a problem with displaying images was the emulator is smarter. It increases heap size when it needs, although it warns about setting heap size.
emulator: WARNING: Setting VM heap size to 384MB复制代码
One step further – How to check for memory leaks
The issue I solved above was not exactly an application memory problem, but the configuration. If your app has a deeper memory problem, here is a way to check if your app is leaking memory with Memory Analyzer based on Eclipse RCP.
It doesn’t require Eclipse so you can just download the standalone version. Download and install it: www.eclipse.org/mat/downloa…
Click Cause GC to run garbage collector.
2. Click Dump HPROF file button to capture memory profile dump.

3. Convert the Android-specific dump file so that our Memory Analyzer can read. (You need platform-tools from Android SDK)
hprof-conv com.leak_sample.hprof com.leak_sample_converted.hprof复制代码
4. Run Memory Analyzer and open the converted hprof file. Then Select Leak Suspects Report(You can cancel and choose this later).
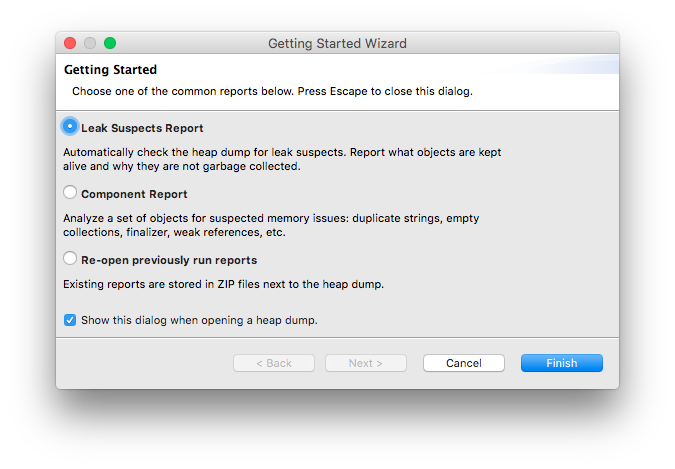
5. Ta-da!
Memory leak example
Let’s assume there’s an Android native module for your React Native app. It has a singleton class setting a listener that calls onUpdate() with creating a String array[10,000,000]. (I know it’s a meaningless class but let’s focus on what we want to see. Be simple.)
Unfortunately, you forgot to clear the listener onDestroy(), which will cause a memory leak every time when you rotate the screen. And you’re wondering why your app dies unexpectedly.
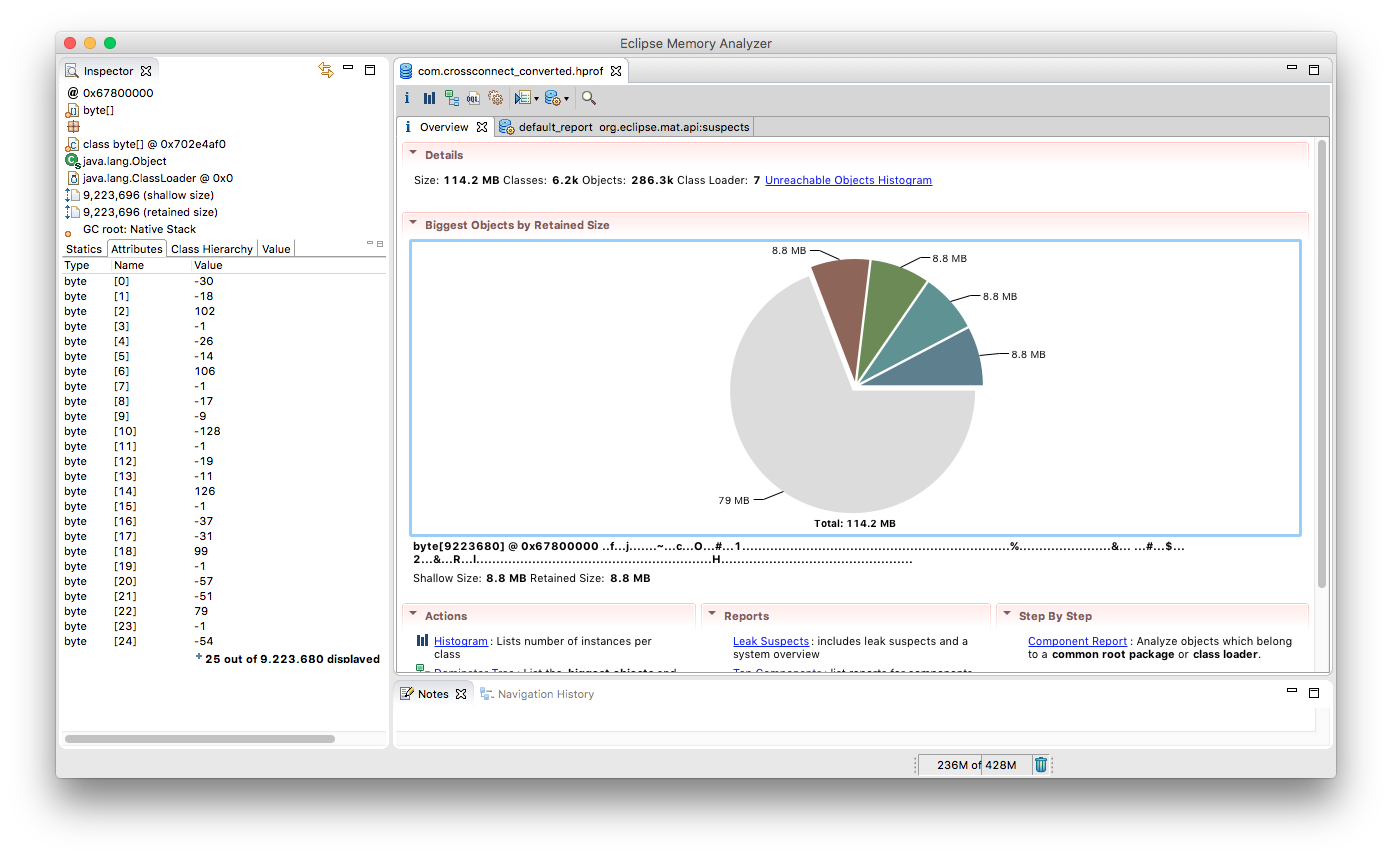
Here’s the screen of Memory Analyzer after following the 5 steps above:
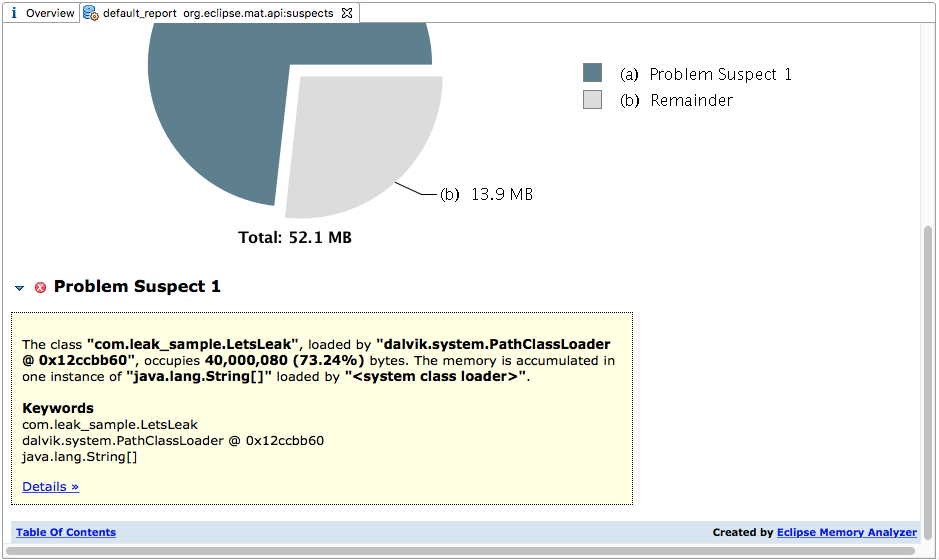
As you can see, LetsLeak class consumed a pretty big portion of memory. Note that it’s a suspect not an actual cause.
Let’s move onto Dominator Tree.

You can see sorted lists of memory usage on Top Consumers, but in this case there’s only one problem suspect, Dominator Tree is a better option to see the details.

On Dominator Tree, Shallow Heap means references for objects, and Retained Heap stands for actual size of all objects contained.
On Inspector, you see the big size of array that you created. You might think, “Okay, I’ve created a String array in the singleton class, but why is the retained heap so big? There should be only one…” Then you would realize that you didn’t release the memory; a pretty common mistake when using a singleton.
Conclusion
A good combination of Android Device Monitor and Memory Analyzer can monitor threads and profile memory which could be used to investigate any kind of memory issue on Android. React Native Android is not an exception.
Like the memory leak example above, a single object holding a bigger heap size than you would expect, is rather easy to catch. However, it’s tough when it comes to tracking down real apps. Using these tools could be a big help without a doubt.
About Leon
Leon Kim is a software engineer at Infinite Red who works from the Far East, South Korea. He studied image processing and pattern recognition in graduate school, developed a prison guard robot as a part of a government research project, and has diverse system development backgrounds across LTE IPsec Security Gateway, Signaling System 7 MTP3 layer and pharmaceutical automation. He loves working as a web and mobile app developer with the amazing folks at Infinite Red and enjoys having Korean BBQ with friends every Friday night. (불금!)
Have questions? Comments? I’m @leonskim on Twitter Or visit us at Infinite Red.


 8225
8225

 被折叠的 条评论
为什么被折叠?
被折叠的 条评论
为什么被折叠?
 到【灌水乐园】发言


