


Spark Window Functions 有下列的属性
- 在一组行上面执行计算,这一组行称为Frame
- 每行row对应一个Frame
- 给每行返回一个新的值通过aggregate/window 函数
- 能够使用SQL 语法或者DataFrame API
1、创建一个简单的数据集
from pyspark.sql import Window
from pyspark.sql.types import *
from pyspark.sql.functions import *

empsalary_data = [
  ("sales",     1,  "Alice",  5000, ["game",  "ski"]),
  ("personnel", 2,  "Olivia", 3900, ["game",  "ski"]),
  ("sales",     3,  "Ella",   4800, ["skate", "ski"]),
  ("sales",     4,  "Ebba",   4800, ["game",  "ski"]),
  ("personnel", 5,  "Lilly",  3500, ["climb", "ski"]),
  ("develop",   7,  "Astrid", 4200, ["game",  "ski"]),
  ("develop",   8,  "Saga",   6000, ["kajak", "ski"]),
  ("develop",   9,  "Freja",  4500, ["game",  "kajak"]),
  ("develop",   10, "Wilma",  5200, ["game",  "ski"]),
  ("develop",   11, "Maja",   5200, ["game",  "farming"])]

empsalary=spark.createDataFrame(empsalary_data,
    schema=["depName", "empNo", "name", "salary", "hobby"])
empsalary.show()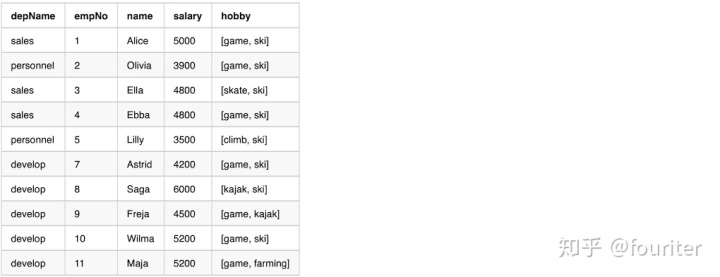
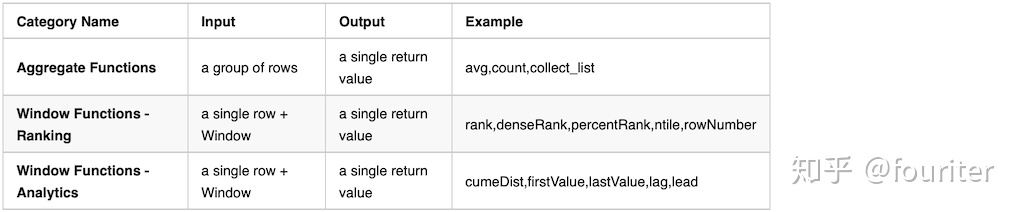
2、Spark Functions
在spark函数中,只有Aggregate Functions 能够和 Window Functions搭配使用
其他类别的函数不能应用于Spark Window中,例如下面的一个例子,使用了函数array_contains,(collection functions的一种),spark会报错
overCategory = Window.partitionBy("depName")

df = empsalary.withColumn(
"average_salary_in_dep",array_contains(col("hobby"),"game").over(overCategory)).withColumn("total_salary_in_dep",sum("salary").over(overCategory))
df.show()
## pyspark.sql.functions.array_contains(col,value)
## Collection 函数,return True if the array contains the given value.The collection elements and value must be of the same type
df = spark.createDataFrame([(['a', 'b', 'c'],),([],)],['data'])
df.select(array_contains(df.data,'a')).collect()
[Row(array_contains(data,a) = True,Row(array_contains(data,a) = False)]
3、Basic Frame with partitionBy()
A Basic Frame有下列的属性
- 被一列或者多列的Window.partitionBy生成
- 每行对应一个Frame
- Frame在同一个partition里面是相同的
- Aggregate/Window functions 可以运用于每个row+frame 去生成单个的值
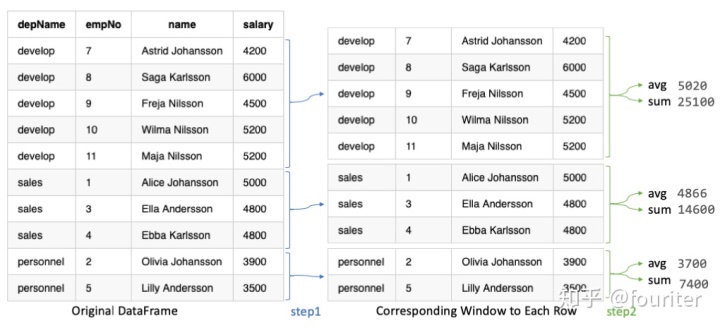
如上图所示的,在一个department里面计算平均的salary和总的salary
overCategory = Window.partitionBy("depName")
df = empsalary.withColumn(
"salaries", collect_list("salary").over(overCategory)).withColumn(
"average_salary",(avg("salary").over(overCategory)).cast("int")).withColumn(
"total_salary",sum("salary").over(overCategory)).select(
"depName","empNo","name","salary","salaries","average_salary","total_salary")
df.show(20,False)
Here is the output from the previous sample code
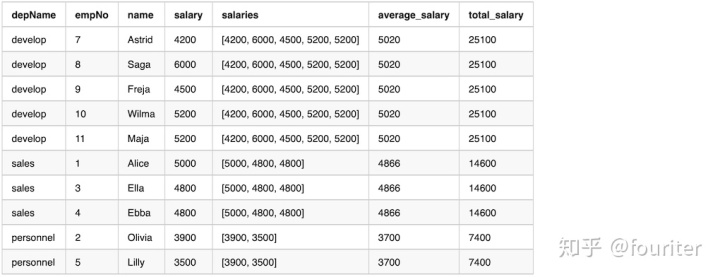
From the output,we can see that column salaries by function collect_list has the same values in a window
3、Ordered Frame with partitionBy and orderBy
an Ordered Frame has the following traits
- 被一个或者是多个columns生成
- Followed by orderby on a column
- Each row have a corresponding frame
- The frame will not be the same for every row within the same partition.By default,the frame contains all previous rows and the currentRow
- Aggregate/Window functions can be applied to each row+frame to generate a value
Here is the sample code
overCategory = Window.partitionBy("depName").orderBy(desc("salary"))
df = empsalary.withColumn(
"salaries",collect_list("salary").over(overCategory)).withColumn(
"average_salary",(avg("salary").over(overCategory)).cast("int")).withColumn(
"total_salary",sum("salary").over(overCategory)).select(
"depName","empNo","name","salary","salaries","average_salary","average_salary")
df.show(20,False)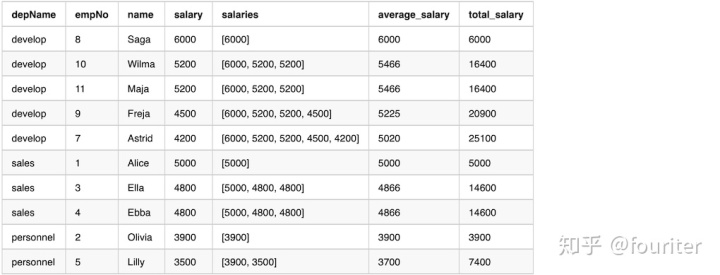
从输出可以看到salaries在一个window里面是不一致的,the values are only from unboudedPreceding until currentRow
4、Rank funtions in a group
下面是在spark中被支持的rank functions
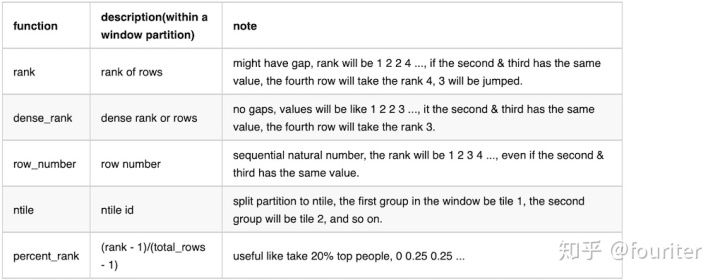
下面是例子
overCategory = window.partitionBy("depName").orderBy(desc("salary"))
df = empsalary.withColumn(
"salaries",collect_list("salary").over(overCategory)).withColumn(
"rank",rank().over(overCategory)).withColumn(
"dense_rank",dense_rank().over(overCategory)).withColumn(
"row_number",row_number().over(overCategory)).withColumn(
"ntile",ntile(3).over(overCategory)).withColumn(
"percent_rank",percent_rank().over(overCategory)).select(
"depName","empNo","name","salary","rank","dense_rank","row_number","ntile","percent_rank")
df.show(20,False)
下面是输出的结果
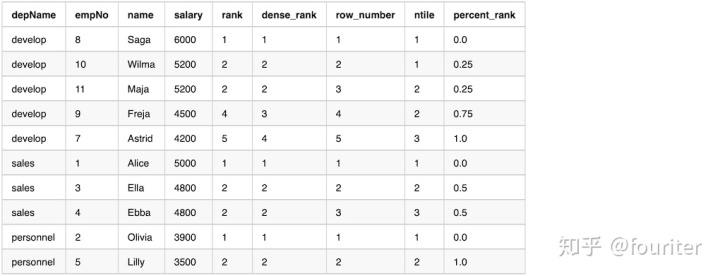
利用rank函数,我们能快速的得到类似于top2之类的数据
overCategory = Window.partitionBy("depName").orderBy(desc("salary"))
df = empsalary.withColumn(
"row_number",row_number().over(overCategory)).filter(
"row_number <= 2").select(
"depName","empNo","name","salary")
df.show(20,False)
5、lag & lead in a group
lag & lead 当我们想拿到没行的前一个element或者是后一个的时候会用到
lag 的意思是拿到当前value的前一个
lead 的意思是拿到当前value的后一个
overCategory = Window.partitionBy("depname").orderBy(desc("salary"))
df = empsalary.withColumn(
"lead",lead("salary",1).over(overCategory)).withColumn(
"lag",lag("salary",1).over(overCategory)).select(
"depName","empNo","name","salary","lead","lag")
df.show(20,False)
输出如下
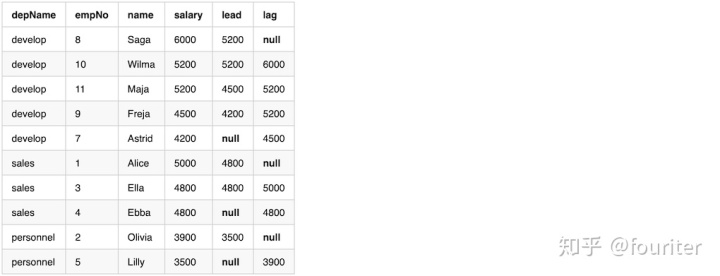
从结果可以看到,lag的第一个值是null,lead的最后一个值是null
然后我们可以计算lag或者lead行跟当前行的差,这种做法在特征加工里面是很常见的一种方式
diff = df.withColumn(
"highter_than_next",col("salary") - col("lead")).withColumn(
"lower_than_previous",col("lag") - col("salary"))

diff.show()
然后diff会有null值,这里用0去替换null
diff = df.withColumn(
"highter_than_next",when(col("lead").isNull(),0).otherwise(col("lead"))).withColumn(
"lower_than_previous",when(col("lag").isNull(),0).otherwise(col("lag")))
diff.show()
假如要找到下一个salary比当前2倍还大的行
diff.filter(col("higher_than_next") > (lit(2)*col("salary"))).show(3)6、Running Total(计算累计)
overCategory = Window.partitionBy("depname").orderby(desc("salary"))
running_total = empsalary.withColumn(
"rank",rank().over(overCategory)).withColumn(
"costs",sum("salary").over(overCategory)).select(
"depName","empNo","name","salary","rank","costs")
running_total.show(20,False)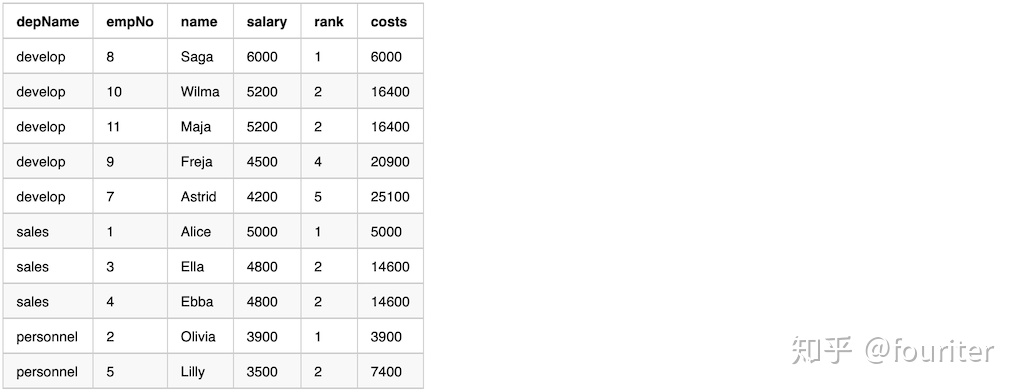
7、Range Frame(自定义区间)
我们可以利用range functions去改变frame的边界(boundary)
- 被生成通过Window.partitionBy 一列或者多列
- 通常是有orderBy的,所以在frame里面的数据是被排序过的
- Then followed by rangeBetween or rowsBetween
- 每行对应一个frame
- frame的边界是被rangeBetween 和 rowsBetween控制的
- Aggregate/Window functions可以被应用到row+frame上去生成单个的值
Threre are two range window functions,here are the functions definitions
rowsBetween(start,end)
rangeBetween(start,end)
both functions accept two parameters,[start,end] all inclusive.The parameters value can be Window.unboundedPreceding,Window.unboundedFollowing,and Window.currentRow.Or a value relative to Window.currentRow,either negtive or positive.
rowsBetween get the frame boundary based on the row index in the window compared to currentRow here are a few examples and it's meaning
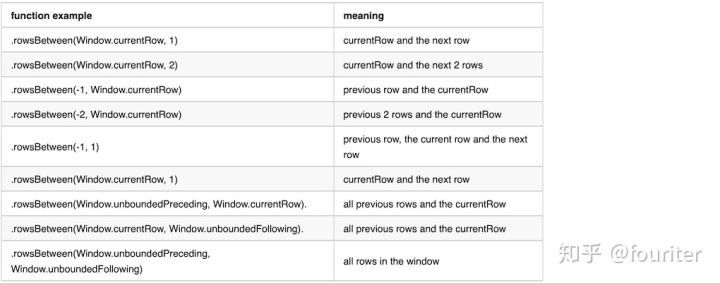
rangeBetween 拿到frame的边界基于window内的row value,the difference compares to rowsBetween is that it compare with value of the current row
Here is the value definition of the constant values used in range functions
Window.currentRow = 0

Window.unboundedPreceding = Long.MinValue

Window.unboundedFollowing = Long.MaxValue
下面是直接使用Window.partitionBy没有使用orderBy的例子,从输出我们能看到数据是随机的
overCategory = Window.partitionBy("depName").rowsBetween(
Window.currentRow,1)
df = empsalary.withColumn(
"salaries",collect_list("salary").over(overCategory)).withColumn(
"total_salary",sum("salary").over(overCategory))
df = df.select("depName","empNo","name","salary","salaries","total_salary")
df.show(20,False)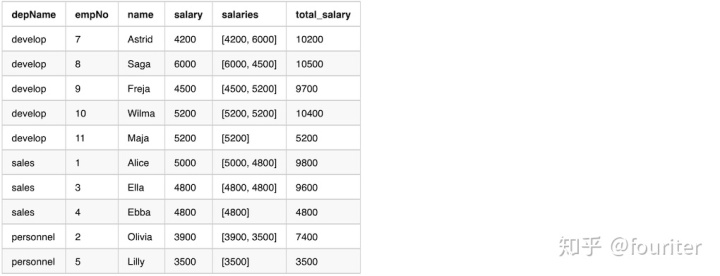
8、Median
mean(avg)和median是最常见的统计方法,在某种意义下,median是比mean更稳定的,因为median会过滤掉异常值

使用Window去计算median
## 先定义一个udf函数
@udf("long")
def median_udf(s):
index = int(len(s) / 2)
return s[index]
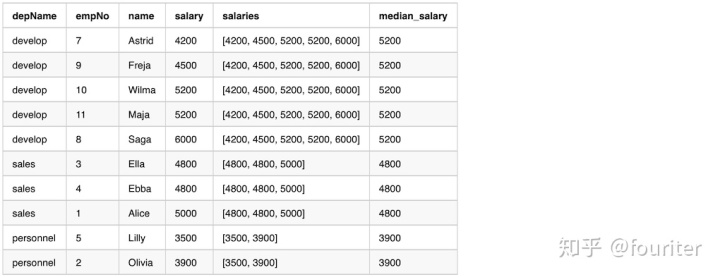
overCategory = Window.partitionBy("depName").orderBy("salary").rowsBetween(
Window.unboundedPreceding,Window.unboundedFollowing)
df = empsalary.withColumn(
"salaries",collect_list("salary").over(overCategory)).withColumn(
"median_salary",median_udf(col("salaried")))
df = df.select("depName","empNo","name","salary","salaries","median_salary")
df.show(20,False)输出结果如下
使用groupBy 计算median然后join回原表
dfMedian = empsalary.groupBy("depName").agg(
      sort_array(collect_list("salary")).alias("salaries")).select(
      "depName", "salaries", median_udf(col("salaries")).alias("median_salary"))
df = empsalary.join(broadcast(dfMedian), "depName").select(
        "depName", "empNo", "name", "salary", "salaries", "median_salary")
df.show(20, False)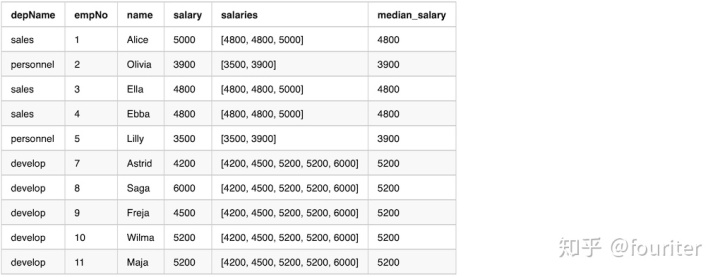


 3535
3535


 被折叠的 条评论
为什么被折叠?
被折叠的 条评论
为什么被折叠?
 到【灌水乐园】发言


