


一、层次聚类
1、定义每一个观测量为一类
2、计算每一类与其他各类的距离
3、把距离最短的两类合为一类
4、重复步骤2和3,直到包含所有的观测量合并成单类时
(一)系统自行进行分类:
####层次聚类par(mfrow = c(1,1))data(nutrient,package = "flexclust")####读取自带数据row.names(nutrient)####数据中心标准化scale()nutrient_sView(nutrient_s)#####用dist()函数求出距离euclidean-欧几里得距离常用d#####求出距离带入hclust函数中用ward方法聚类cnutrientplot(cnutrient,hang = -1,cex=.8,main='averher linkage clustering')注: 1.每一个图形设备都有自己的绘图参数,如果当前还没有打开绘图设备,那么函数par()在进行参数设置之前会自动的打开一个新绘图设备。
直接在R编辑器中输入命令par()或者par(no.readonly=TRUE)都可以获取当前的各个绘图参数。
参考:https://www.jianshu.com/p/5d44a08f67a5
2.R语言改变大小写 toupper()和 tolower()函数
这些函数改变字符串的字符的大小写。
语法
toupper()和 tolower()函数的基本语法为:
toupper(x)tolower(x)
3.scale is generic function whose default method centers and/or scales the columns of a numeric matrix.
4.dist函数中的距离计算方法有很多种
This must be one of "euclidean", "maximum", "manhattan", "canberra", "binary" or "minkowski"。
4.hclust(d, method = "complete", members = NULL)
层次聚类函数:使用的方法为:the agglomeration method to be used. This should be (an unambiguous abbreviation of) one of "ward.D", "ward.D2", "single", "complete", "average" (= UPGMA), "mcquitty" (= WPGMA), "median" (= WPGMC) or "centroid" (= UPGMC).
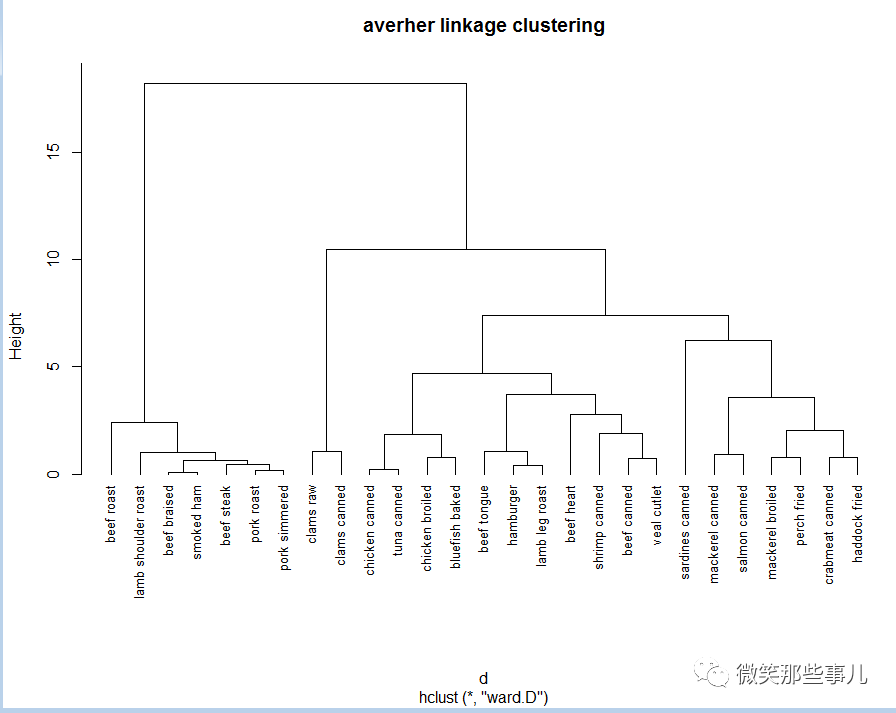
图中纵坐标:一组n-1实值(对于超度量树是非递减的)。聚类高度:即与特定聚集的聚类方法相关联的标准值。
(二)探究模型确定聚成几类合适
####用NbClust函数确定聚类K值####首先先加载NbClust包library(NbClust)NCtable(NC$Best.n[1,])##具体显示K取多少会分类效果最大化barplot(table(NC$Best.n[1,]))##用条形图进行展示注:NbClust软件包提
 最低0.47元/天 解锁文章


 2万+
2万+


 被折叠的 条评论
为什么被折叠?
被折叠的 条评论
为什么被折叠?
 到【灌水乐园】发言


