


转自:http://www.cprogramming.com/tutorial/debugging_concepts.html
Part 1: Debugging Concepts
by Patrick MancierWhenever you write C++ programs, inevitably you're going to have to debug the program. This series of articles will discuss how to debug using Visual Studio, but first, we'll need to start out with an overview of important concepts used by debuggers.
Local Debugging
Local debugging involves running the program you are debugging runs on the same machine as the debugger. For most situations, this is what people will do. Debugging locally has the least amount of latency involved. In other words your program will respond to the debugging environment best if the debugger is running on the same system. However, (第一个缺点:)a disadvantage is if for some reason the process traps and causes the system to crash to a blue screen or the debugger hangs up, you have to wait for things to restart to see what may have happened. (第二个缺点:)Another disadvantage is that it may be difficult to debug, watch variables and see the trace output while you're running a program on the same system. If your application is a GUI and it takes up the entire screen, it's a little difficult to switch back and forth as your debugging. The best situation for debugging code locally is to have two screens hooked up to your system. This way, you can run the program on one screen and debug it on the other.
Remote Debugging(较为好的一种调试方法,但是如果网络不好会影响调试的流畅度)
Remote debugging means that the program your debugging is running on a separate machine and the debugging takes place on an isolated box. Remote debugging usually takes place over a network connection. Visual studio has a special program that is used to set up a remote debugging session. Other than the fact that the process is running on a separate machine, debugging remotely is really no different than running locally from the perspective of the IDE. However, there is some latency issues to deal with, but if your target machine and the debugging machine are communicating on the same network switch these issues really aren't that bad. Using a remote debugging setup is similar to having two screens hooked to one system.
Breakpoints(断点)
Breakpoints are simply spots in the code that are marked to tell the debugger to stop the programs execution at that point when the program counter is set for that particular line in code. Breakpoints have various uses and to set one is completely dependent on the situation. Many people will set a breakpoint just to make sure a specific function is being called for example. Another example is a breakpoint is set to check the value of a variables or memory after various sets of instructions.
Breakpoints can also be set up to execute on a specified condition. For example, if you're running code in a loop and you want the breakpoint to trigger on the third iteration, you can set up a 'conditional breakpoint(条件断点)'. Basically set up the breakpoint to check for this condition and when the condition is met the program execution will stop.
Whatever the case may be, breakpoints are the cornerstone of effective debugging. The use of breakpoints in Visual Studio will be detailed more in the section of the setting up the IDE.
Trace output
Visual Studio has what is called an 'Output' window. This window serves a variety of purposes. It gives a status of how the compilation of a program is going; it shows the various responses to linking. It also shows the output of a 'Trace'. A trace is simply a macro in Visual Studio that is used to print out a log message onto the output window.(程序员也可以在自己的程序中加入TRACE宏,从而追踪程序错误) This is an effective tool for watching the status of how a program is running in a quasi-real time fashion. It is difficult to use sometimes depending on how your program runs. Generally you would want to use this window for user type events, for example when the user selects an item on a list control you might want to put up in the trace window the output of the selected index.
Dump files(转储文件,用来存储程序的运行状态)
Dump files are simply files that are used to save the program run state. To create a dump file, supporting code in the program must be written. Generally dump files are generated on some type of exception. The dump file contains the symbolic debug information, the current line the program is on, all sorts of other program information. The general idea is to take the dump file of a program that has trapped, pull this dump file into the debugger, associate it with some source code and effectively see what state the program was in as if you were debugging it there as it was running. The dump file is a very useful tool for released code that is running in the field. It is a tool that a software engineer can use to check for problems as code runs over time. It is not always easy to reproduce conditions that cause a bug in the lab; sometimes it may take more effort to reproduce and the dump file gives the software engineer a view into what is happening when the exception occurs.
Log files
Log files are simply text-based output of a program that is running. The log file mechanism itself can range from a simple appending of a text file to something more complex like a separate thread or process that accepts incoming queued log entries and writes them out asynchronously.
A properly set up log file framework will track various levels of information. For example, with a default setting maybe just warnings, errors and basic information are tracked. With another setting, perhaps a specific module, feature or thread is tracked. With another setting, all function entries and exits are checked. It is advisable to make this trace level configurable, putting it in a registry entry or an INI file.
Log files are an essential part of debugging because they act as a flight recorder. When a program traps, the log file can give the software developer clues as to what was occurring before the trap that an IDE debugger may not necessarily be able to provide. Stepping through code sometimes produces different results than just allowing the program to run and the log file allows tracking of information while minimizing the latency associated with full IDE debugging.
Part 2: Setting up the IDE
by Patrick MancierIn this article series, we discuss the concepts of debugging with Visual Studio 2005/2008. Part one covered general debugging concepts; part two will explain how to configure the Visual Studio IDE for debugging.
Setting up the IDE for the debugger
IDE Behavior
The Visual Studio IDE is designed to act as a workspace. It is very close to a multiple document interface with a twist in that it provides a rich set of docking controls in order to arrange your workspace. It is fully customizable by the user, down to where the window panes are placed, how the menu items are arranged and the buttons available on toolbars. It is up to the individual as to how this workspace is set up but generally most people have a menu and toolbars on top, an adequately sized code window, a solution/class/resource browser on the left or right of the screen, and an area below the code window that has all the other various windows used in programming and debugging.
The Visual Studio IDE is designed to maintain different profiles while coding or running. When you execute a program through the IDE as a debug session, the IDE changes its appearance from how it looks as a coding profile to the arrangement as the debugging profile. It is entirely possible to make each profile look exactly the same, but in practice this is impractical. For example while coding you may want to maximize your code writing space while in debug you want to split this space between the code itself and the watch variables pane.
On a good day, you can launch your program from the IDE, debug it, and switch from code view to debug view. You debug your program and when you close it, the IDE then switches back to the code view. As you can see from the examples below each view serves different purposes and it is up to the individual as to how to arrange these views for maximum benefit.
Below is a typical example of the code view in the IDE.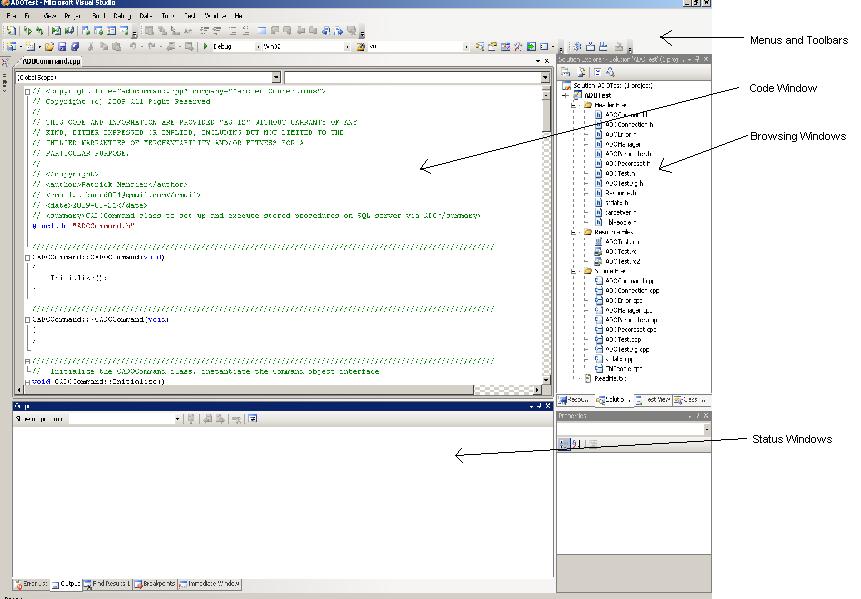
Below is a typical example of the debugging view in the IDE

Debugging Options
General
Visual Studio has a rich set of options available for debugging. Many of these options involve the .NET framework and do not serve our purposes here. To get to the debug options for Visual Studio go to Tools/Options and then open up the Debugging selection in the tree.
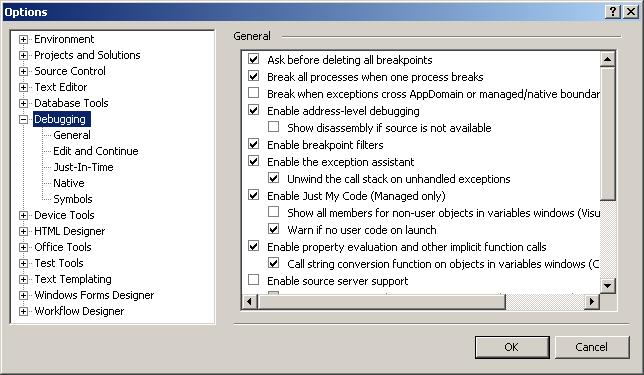
Below are some of the pertinent option descriptions for C++ use.
(对debug选项的详细解释)
Ask before deleting all breakpoints - This option if set will 'warn' the user before choosing to delete the breakpoints, otherwise it will do it silently. There is a button that can be added onto the toolbar to delete all breakpoints.Enable address-level debugging - This tells the debugger to enable the things like the disassembly window, register windows and address breakpoints during the debug session.
Show disassembly if source is not available - This will disassemble code at the points that the source does not exists.
Enable breakpoint filters - Enables/Disables the ability to set filters on breakpoints affecting processes and threads.
Require source files to exactly match the original version - This simply means that when debugging if the source files and the symbolic debugging information do not match that the debugger will not launch unless specified by the user to do so. The IDE will ask to provide the matching source as an option.
Warn if no symbols on launch (Native Only) - The debugger will prompt the user that it cannot find the symbols file for native code. Unless you're doing some advanced debugging, this usually isn't an issue.
Symbols
The Symbols dialog is designed to set up the program to use debugging symbols for various library calls that Microsoft uses. A symbol file contains the same debugging information that the executable contains, the only difference being it is stored in a debug file (dbg) or a program database file (pdb). This can be used for example to debug a DLL file whose code is not referenced directly.
This dialog is where you can specify various dbg and pdb files or to reference and to cache symbols from a symbol server. Microsoft maintains symbol servers for all of their major O/S's and other Microsoft products. The idea is to point to this symbol server, cache the symbols and use them in debugging. Basically this will give you an idea of what libraries are being called on the operating system level during program execution.
Below is the dialog with the address of the Microsoft symbol server added and a directory to cache the symbols.

Below is what happens after adding the Microsoft symbol server and pressing OK.

Below are a set of links that talks more in depth about symbol files and what they do.
Symbol server linkDownloading Symbol Package
How to use the Symbol Server
Customizing an IDE Toolbar
As previously mentioned, the Visual Studio IDE workspace is completely customizable. This was true even with previous versions of Visual Studio before 2005. The default configuration of the IDE is adequate for most things but for debugging it is a bit lacking. For example, the debug bar does not come by default with the delete all breakpoints button. This is a very useful button to have because it makes it simple to remove all breakpoints once a problem has been hashed out.
To begin customizing a toolbar, right click somewhere on the menu bar of the IDE. A long list of available toolbars will be presented. On the last item of the choices is 'Customize'. Select this and the Customize dialog will pop up.
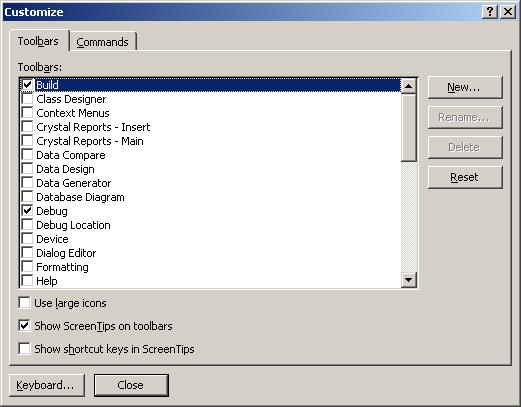
Select the 'Commands' toolbar. You will see two list boxes, one called 'Categories' and another called 'Commands'. Scroll down on the Categories side and select 'Debug'. Then scroll down on the Commands side and select 'Delete All Breakpoints'. Now this is where it gets interesting. You need to position your 'Build' or 'Debug' toolbar close to the dialog box. You can either leave it where it is, or drag it out of its dock and pull it close to the open dialog.

Now, select the 'Delete All Breakpoints' from the categories area and drag and drop it onto your toolbar. You should now see it available for use.

Setting up various debug windows
Setting up the various windows for use in the IDE is fairly simple, it's just a matter of knowing where to find them. You can drag and drop each individual window on any of the available dockers, but the ideal place is usually right below the code window. However this placement it strictly up to the preference of the user.
While your program is running in debug, select Debug and Windows top see the available options.

As you can see there are a lot of options to display various debugging items. Below is a description of what the window is for and a real running example of what each of these windows looks like in practice.
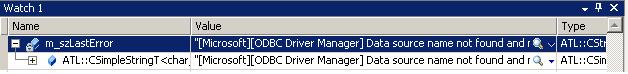
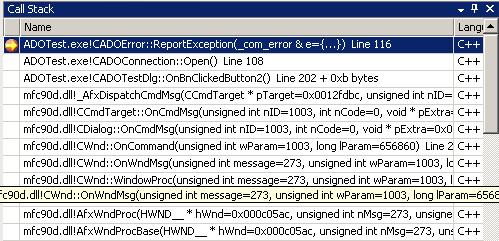
In order to get these examples, below is a snapshot of the IDE after setting a breakpoint and having the code execute it. In this example, the program is processing an exception that was thrown, and the breakpoint is set up in order for the programmer to view the value of m_szLastError string.

Breakpoints Window that at a glance displays the status and the descriptive items associated with program breakpoints

Output The 'Trace' window, it is usually displayed in both code and debug views. You can see in this example that the first chance exception was thrown.

Watch Will allow the user to select the variables and objects in the program and display their values.
Autos Very similar to the watch and locals windows except along with the value of the object or variable, it also displays the expressions from the current line of code some of it around it. You can see that it picks up more than just the current scope of the instruction pointer, it has picked up the variables from the entire function.

Locals Similar to watch except that it displays all the local variables and objects that are being referenced in the current scope.(locals的作用:与watch相似,但是同时却列出了当前scope中所引用的所有的变量和对象)

Immediate Designed to allow the programmer to type in an expression or a variable and get a response immediately given the scope of the program execution.

Call Stack Very useful for when a breakpoint is hit or when the program calls an exception. Assuming the call stack is intact, it gives the user a history of program calls to get to the stop execution point.(Call Stack:给出截至执行停止,程序中所有的函数调用) The user can then select any of the entries to 'go back in time' of the execution and trace backwards things that were happening. When the user does this, the current state of the registers and the variables are changed to reflect the scope that the user is currently looking at.
Threads Gives an overview of the currently running threads, their ID's category, Name, Location and priorities.

Disassembly Displays the disassembled machine code at the point of the break. This is admittedly for advanced programmers but can be very useful if used properly. It can track down exactly what the compiler has done with machine code; you can see line by line how the system registers are being used. This window can be displayed in various modes, but the default is to show the source code inline with the assembly code.

Registers Displays the current system registers. This would normally be used in conjunction with the disassembly window because under normal source code debugging, it is hard to know exactly what each register is supposed to do. There are typical uses for registers that the compiler uses, for example, a return code would be put into the EAX register.

Part 3: Using Breakpoints Effectively
by Patrick MancierIf you go to the Breakpoints window you will see that there is are columns displayed called 'Condition' and 'Hit Counts'. These can be very powerful mechanisms for debugging tricky code. There are a series of mechanisms here that can be used to debug the code. To see these choices, select the breakpoint box and right click to see the menu.
Location
This is an obvious one and usually is set by clicking on the far left line of the code that the programmer wants to break on.
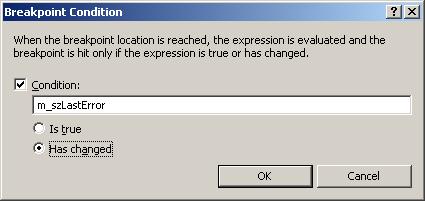
Condition
This checks to see if a specific expression is true or has changed. It does not check specific values other than as a Boolean.
Hit Count

The hit count is used to test a breakpoint for various conditions:
- Break Always:Same as a normal breakpoint
- Break when hit count is equal to: This will check to see when a breakpoint has been hit n number of times
- Break when hit count is a multiple of: Same as a normal hit count except multiples by a factor set by the user
- Break when greater than or equal to: Checks a specific number of times but not only checks an equal value but if it gets hit more than that.
Filter
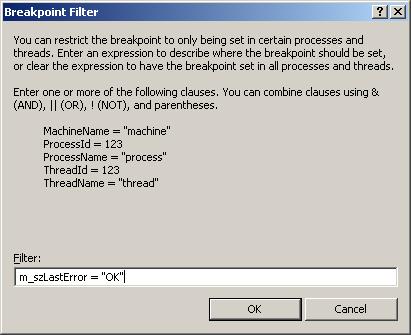
This is used to check a variable or a series of variables for a specific condition or a series of conditions. It can be used to check variables for string or numerical values. A combination filter of AND and OR and NOT can be used to create a custom trigger condition. This is probably the most configurable breakpoint condition of any of the breakpoint modes.
Applications of the breakpoint techniques
What the heck are all these used for? Here is a small list of examples:
- Loop counting
- Recursion debugging
- Counting number of times a variable changes
Let's say for example you're in a loop and it iterates thousands of times. You're trying to track down a tricky problem converting data, for example a string containing a strange character that is being loaded from a file. An exception is thrown and the value does not get set. You have no idea where in the file this is occurring. You do know however what the previous output looks from the last loop iteration. You can set a filter to look at the string variable you are loading with the last known value. You don't have to hit the breakpoint hundreds of times and look at the input from the file each time before you see your error. You can simply set up the filter and let it run until it breaks. After it breaks you can then step slowly through your code to see at what point the exception gets thrown.
Debugging with the IDE
This the toolbar we customized earlier.
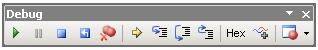
The uses of some of these buttons are obvious, some of them not so obvious.
 F5: Start Debugging/Continue - This launches an executuable or to continue after the debugger has stopped execution
 Ctrl+Alt+Break: Break All - This button in effect pauses or suspends the execution midstream. The debugger will stop at wherever the program counter line is pointing to, show the part in the code that it stopped at and you have access to everything as if it hit a regular breakpoint. One example of its use is for situations where there may be a runaway recursion, loops or some thread that has been improperly coded and is starving the process for execution cycles. It can show you were the execution of the program is tied up.
 Shift+F5: Stop Debugging - This button stops the process wherever it is and detaches from the process and exits the debugger. This button is not guaranteed to produce stable results however, depending on what the application is doing could lead to various issues, such as having a thread shutdown properly or an I/O callback to be executed. These type of operations may cause Visual Studio to hang if an attempt is made to stop debugging.
 Ctrl+Shift+F5: Restart - This button stops the current execution, detaches from the process, exits the debugger and then attempts to restart. Using this button can have similar issues as using the 'Stop Debugging' feature.
 F11: Step Into - This button is designed to allow the programmer to enter a function or a class allocation without having to set a breakpoint in the code. This is very useful for situations where you have a top level function that calls several other functions and you want to track the program flow going into that particular desired function. What will happen is when you enter a function, the debugger either jumps to another part of the code on the page if it exists in the same module, or loads the pertinent module for you and takes you to the beginning of the entered function. During this time you can continue to step line by line and watch where the program cursor goes to see what is happening in the code. You can of course set up watch variables along the way to monitor the function you stepped into.
 F10: Step Over - Step over is an excellent button to use. The reason is there are times where you may not necessarily want to step into every single function or every single initialization. You may want to execute the entire line and 'hop' over it. For example, if you're in a loop and you want to skip several lines, clicking on this button repeatedly will allow you to do it.
 Shift+F11: Step Out - Step out is another very useful button. This is a great button to use for situations where you are trying to step into a function that contains various parameters that require instantiation or it steps into another function before actually entering the function you would like to see. It avoids having to step completely through the unwanted function. It's akin to knocking on a door looking inside and seeing that things are pretty crazy, you really don't want to go in so you step back out. An example of this could be where you are passing a CString as a parameter into a function and as you step in you don't really care to watch all the allocation code execute, so hitting this button and then hitting step in again will skip the allocation of the CString and continue entering the function you want to step into.
So far we have discussed several parts of the IDE, how to set them up and how to get to them. We have not done a lot to describe how to actually use these tools. Below is a snapshot of the code we would like to debug. We want to step through this code, examine class members, return codes and step into the various other functions that exists in the code. How do we accomplish this? Well we fire up our code.

Before we begin, we can set up some watch variables. To do this, first go to the Debug->Windows->Watch menu select any Watch window 1 - 5. The watch window will appear to float in the IDE, you may want to dock it somewhere, preferably somewhere below the code window. When it is displayed below, you can take any variable you see in the code and select it and drag it into the watch window. Alternatively you can just type it in manually as a new entry into the watch window. Either way, you are now tracking this variable. You are not limited to just variables, it could be an interface or an object. During debugging you can also keep the Locals or the Autos pane up. This will detail all the current local variables that are in your functions. If you are in a code that is part of a C++ class, it will also provide a 'this' pointer that you can break out and examine the variables during execution.
As you are stepping through and executing the code, if you watch what happens in any of these debugging windows you have set up, you will see that as variables change, they will be colored from black to red. This is true of when you have a memory window displayed as well. Any bytes that are changed in the memory window will be turned from black to red.
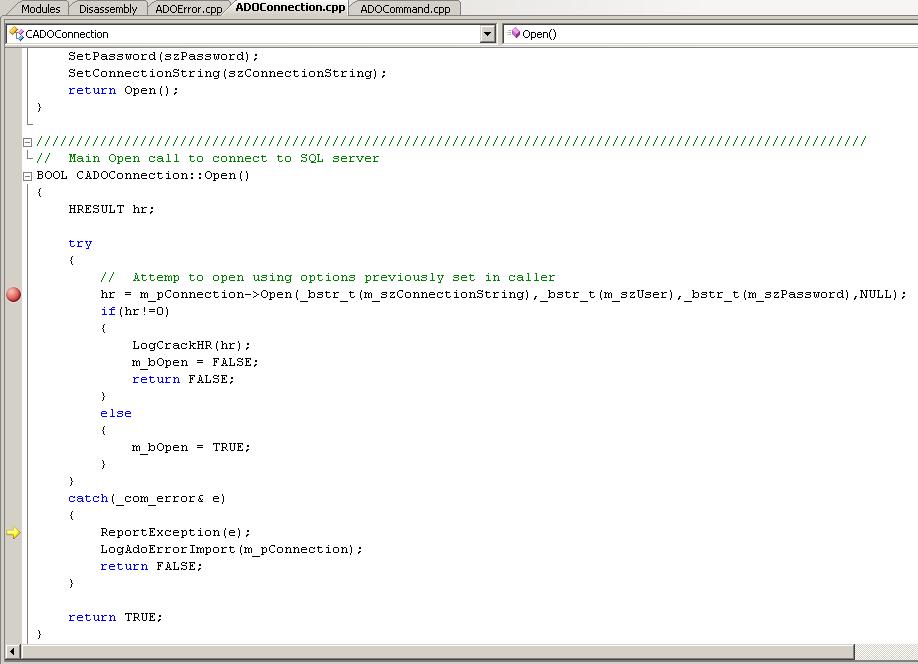
We begin the execution of our code using the 'Start Debugging' button and when it starts, it at some point hits the breakpoint we set in the code. Once the breakpoint is hit, there is a yellow arrow called the instruction pointer that is overlaying the breakpoint. This instruction pointer always points to next instruction line that the debugger is going to execute.

Now that we are here, let's say we do not care to 'step into' the first call to m_pConnection->Open(). We don't care what happens in there at all. Clicking on the 'Step Over' functions results in calling this function. Since we failed to define some of our parameters properly (on purpose in this case) an exception is thrown (more on that soon). The exception is 'caught' and results in the following snapshot:
You can see that the yellow instruction arrow has passed where the breakpoint is and is now pointing to the line that has the call to ReportException() on it. Now we didn't care about the other function, but we do care to see what happens in this function. We go ahead and click on the 'Step Into' function.

Now we are in the actual ReportException() function. We see that the instruction pointer is right at the beginning of the function. Continuing to click on 'Step Into' and get to the line were it calls the Description() function on our exception class.

Well, this is nice we were able to do this, but we don't really care to be in this function. We ended up here because we used the 'Step Into' command in the ReportException() function. We really should have used the 'Step Over command. Well, instead of repeatedly clicking (or hitting F5) on step over, let's just quickly leave the function by clicking on 'Step Out'. This will then take us back to the ReportException() function.
There is still a lot to talk about when it comes to debugging with Visual Studio. We have just gone over some of the basics of debugging in the IDE but from the example you can tell there is more to it than just knowing the IDE. There are various other aspects to debugging that are necessary to know. For example try/catch exception handling and setting up program debug breaks.
Part 4: Setting up Code for the Debugger
by Patrick MancierIn the fourth part of the series on debugging in Visual Studio, we will discuss how to set up your code for the debugger.
Debug break
A direct call to a debug break can be used to stop the execution of a program. Why is this different than a breakpoint and why would you use it? Generally you would use it if you are not going to launch the debug session from Visual Studio, you are going to launch it after the fact. So if we want to try this how is a debug break called in code?
Calling __debugbreak() can be used to generate a software breakpoint. This function is designed to be portable between platforms. You could also use the Win32 version DebugBreak() but it is not portable. So once you call __debugbreak() what happens from there? An exception is thrown and your program stops execution. This gives the programmer the opportunity to use Visual Studio to 'attach' to the process that is running the executable.
To attach to a running process and use the Visual Studio debugger, go to Tools and then select 'Attach to Process'. If you're running locally there is no need to change any of the dialog settings. However, if you are trying to run a debugger session remotely, you will need to change the Transport to Remote, and then the Qualifier to the remote PC you are trying to reach. Either way, once you have the process list simply find the process that you want Visual Studio to attach to and click OK. Visual Studio will then attach to this process and your debug session will begin.
A practical example of using __debugbreak() would be to debug a service. You cannot launch a service directly from Visual Studio; it must be launched with the Service Control Manager. So there is no way to directly debug it from the IDE. You must 'attach' to the process in order to debug it. The problem with debugging a service using this method is that you cannot debug the service from launch; it will simply launch and begin its run state.
Assertions
An assertion in code is a test of a condition and if the condition fails the execution of the program halts. It is designed to only be when the program is complied as debug. When an assert() is called it is accompanied by a message indicating which expression failed, the line number and module where the assertion took place. In a Windows application the assertion will come in a message box. In a console application it will go to the console screen.
In the following example, you can see that the string is tested for NULL. If the char array being passed in is NULL, without the assert in the debug build the memory doesn't exist and an exception would be thrown. Instead, the assert would fail and tell the programmer that something went wrong with this function.
void TestFunc(char *pszName)
{
        assert(pszName==NULL);
        strcpy(pszName,"Tom Smith");
}
The assert macros _ASSERT, _ASSERTE are used during debugging and are only available if the _DEBUG macro is defined. _ASSERTE is used to properly print out any Unicode characters that are in the expression passed to the macro. When either of these assert, that amounts to the report that the assertion failed, it lists the condition that failed and the source code module and line number it failed on. By default, in a Windows application the assertion will come in a message box and in a console application it will go to the console screen.
#define _DEBUG
void TestFunc(char *pszName)
{
_CrtSetReportMode(_CRT_ASSERT, _CRTDBG_MODE_FILE);
_CrtSetReportFile(_CRT_ASSERT, _CRTDBG_FILE_STDOUT);

_ASSERT(pszName==NULL);
strcpy(pszName,"Tom Smith");
}
It may appear on the surface that assert() and _ASSERT, _ASSERTE do the same thing. As far as behavior of halting execution on a failed Boolean condition they do. However the macros are only called when _DEBUG macro is defined. The other difference is that you can define the desired behavior of the assert through a series of calls to _CrtSetReportMode(). This is because the macros invoke a _CrtDbgReportW report message and this mechanism is designed to allow a programmer to track progress of a debug build. You can define the macro assert to report to a debug file, to only use the console window instead of a message box, etc.
Exception Handling
Exception handling is essentially a way for the programmer to do error handling on parts of code that may fail under certain conditions without halting the program. For example, if a character array is access without having its memory defined it would normally throw a first chance exception and the operating system would halt the program. With exception handling this is caught and can be handled by the programmer.
Here is an example of exception handling in code. Assume that the *pszName character array passed into this function is NULL. You can see from this example that the program doesn't actually halt, what happens is when the strcpy call is 'tried', the exception is thrown by the operating system but is 'caught' by the catch block. So instead of halting the program, the program reports the error and returns FALSE instead of TRUE from this function. The syntax catch(.) means that ANY exception will be caught and handled.
BOOL TestFunc(char *pszName)
{
        try
        {
            strcpy(pszName,"Tom Smith");
        }
        catch(.)
        {
            printf("ERROR: Cannot copy string into pszName!\n");
            return FALSE;
        }

        return TRUE;
}

void main()
{
char *pszMyName = NULL;

        if(TestFunc(pszMyName)==FALSE)
        {
          printf("ERROR: Forgot to instantiate array, aborting");
          exit(-1);
        }

        exit(0);
}
Catching any exception is ok for very quick generic stuff but is not all that useful in tracking what the specific issue might be. How do we narrow down the exception handling to specific items? This is easily handled by using a throw and defining the specific exception in the catch block we need. Here the exception of char * is the only thing that will be checked for an exception. When the check for NULL is made on the variable and we force the exception with the throw call, we can tell the exception handler exactly what caused the problem.
BOOL TestFunc(char *pszName)
{
    try
    {
        if(pszName == NULL)
        {
           throw "ERROR: pszName parameter was NULL!";
        }
        strcpy(pszName,"Tom Smith");
        }
        catch(char * error)
        {
            printf("ERROR: %s, pszName == NULL, cannot copy name into array\n",error);
            return FALSE;
        }

        return TRUE;
}

void main()
{
        char *pszMyName = NULL;

        if(TestFunc(pszMyName)==FALSE)
        {
            printf("ERROR: Forgot to instantiate array, aborting");
            exit(-1);
        }

        exit(0);
}
The items that are put into the catch function are not limited to just variable types. A class can be passed that is used to hold exception data. Below is an example of this type of class exception. You can see that there are now two types of exceptions that are throw using the class, we pass the enumeration into the constructor in order for the class to track what the exception is.
enum ExceptionErrors
{
    ArrayIsNull=1,
    ArrayNotBigEnough
};

class CMyException
{
        int m_iErrorCode;

public:
    void ShowDescription()
    {
       if(m_iErrorCode & ArrayIsNull)
       {
          printf("ERROR: Array variable was NULL\n");
       }

       if(m_iErrorCode & ArrayNotBigEnough)
       {
          printf("ERROR: Array size to small\n");
       }
    }

    CMyException(int iError){m_iErrorCode = iError;}
};

BOOL TestFunc(char *pszName, int iNameLength)
{
        try
        {
                if(pszName == NULL)
                {
                        throw CMyException(ArrayIsNull);
                }

                if(iNameLength < strlen("Tom Smith"))
                {
                        throw CMyException(ArrayNotBigEnough);
                }

                strcpy(pszName,"Tom Smith");
        }
        catch(CMyException& me)
        {
                me.ShowDescription();

                return FALSE;
        }

        return TRUE;
}

void main()
{
char *pszMyName = NULL;

        if(TestFunc(pszMyName)==FALSE)
        {
          printf("ERROR: Forgot to instantiate array, aborting");
          exit(-1);
        }

        exit(0);
}
Miscellaneous Debugging Calls
There are other calls that can be made to perform some types of debugging. The reasons to use these types vary but generally these are all called to halt execution of a running program due to some error condition.
- abort - Halts the current program whenever this line is called
- raise - Halts the program with a specific error, abnormal termination, floating point error, illegal instruction, CTRL+C interrupt, illegal storage access and a request to terminate.
- signal - This is similar in concept to raise with the difference being you must define your own error handler. The general idea is you raise the normal signal and then perform post process error handling.
PART 5: Logging and Tracing
by Patrick MancierWhenever you write C++ programs, inevitably you're going to have to debug the program. In this article, discover how to use logging to make your programs much easier to debug--without needing a debugger.
Trace and Logging messages
TRACE Macro
Tracing is a feature in Visual Studio that allows the programmer to put a log message onto the main output window. The mechanism is fairly simple to use. It is only active with debug builds, in a release build none of the trace messages will be displayed.
The TRACE macro contains a format specified string argument that can contain any number of variable arguments. For a simple message it is very simple.
void TRACETest()
{
    TRACE(_T("Hello World!"));
}

To add variables to this use the following format:

void TRACETest2()
{
    char *pszPlanet[] = {"Earth","Mars"};
    int iNumberPlanets = 2;

    TRACE(_T("Hello World! We are visiting %d planets.  First stop:%s, Second stop:%s"),iNumberPlanets,pszPlanet[0],pszPlanet[1]));
}
If you are debugging MFC it is better to use the TRACEn where n = 0,1,2,3 and stands for the number of arguments that are being passed into the string that you are using. However, be forewarned that TRACEn is now an obsolete macro and MSDN recommends using ATLTRACE instead.
ATLTRACE Macro
ATLTRACE is a macro used for debugging in MFC or ATL. This macro has two versions. The first version has this signature: ATLTRACE(exp) where exp is basically a formatted string and a number of variable arguments. This is the same behavior as the older TRACE macro. The second version has this signature:ATLTRACE(DWORD category,UINT level,LPCSTR lpszFormat,...)
NOTE: In order to get the information that applies to this version, you need to refer to ATLTRACE2. ATLTRACE. actually calls this second version and was designed this way to keep the backwards compatibility.
DWORD category - Defines the type or method to report.Referring to the MSDN document you can see that ATLTRACE has a much higher level of tracing than just the normal TRACE macro. There are a set of ATL and MFC categories that can be set to track.
You can even declare a custom category by declaring a global instance of the CTraceCateogry class and making it a macro.
CTraceCategory MY_CUSTOMCONTROL(_T("MyCustomControlName"), 1);
The first parameter is the name of your category, the second parameter is the log level you want this to appear in and can range from 0 . 4.
UINT level - Defines the level of tracing requested and is set to 0,1,2,3,4. This level will suppress or add logging messages as requested. The messages that are displayed are dependent on whether or not the message being requested exists at this log level.
LPCSTR lpszFormat, ... is the formatted string and the list of variables that are used for the formatted string.
Report Macros
Visual Studio provides a built in debug reporting mechanism for logging. The basic idea here is to configure the mechanism to its desired behavior and use it to track program progress and to report errors. These are _RPT, _RPTF, _RPTW, _RPTFW. The .W. versions of these macros are simply for Unicode implementations.
To use these reporting macros you must include the crtdbg.h header file. There are two basic macros, RPTn, _RPTFn, n=0,1,2,3,4,5. Both essentially do the same thing. The n is for the number of arguments that string contains. The only difference between these two macros is the _RPTF provides the file name and line number where the macro is executed. This may or may not be useful but generally if used in conjunction with the ASSERT macros this function probably does not need to be used because an assert will provide this information by default.
The basic idea is to send a message string to the macro that will be sent to the debug report. Each macro is called with a reportType and the message string and its parameters. The following example illustrates how to use it.
#include

void ReportMacroTest()
{
    int iCount = 21;
    char pszName[] = "Harry";

    _RPT1(_CRT_WARN,"Reporting that iCount == %d",iCount);
    _RPT2(_CRT_WARN,"Reporting that %s is %d years old" ,pszName,iCount);
}
This reporting mechanism can be configured in different ways. The two functions that are used to configure the mechanism are _CrtSetReportMode and _CrtSetReportFile.
Below is a rehash of the MSDN documentation.
_CrtSetReportMode has two parameters:
int reportType - This is set to any of the three reports types:
- _CRT_WARN for warnings and information only
- _CRT_ERROR for errors that require immediate attention
- _CRT_ASSERT for assertion failures
- _CRTDBG_MODE_DEBUG - Write the message to the debugger window, usually the Output window in Visual Studio
- _CRTDBG_MODE_FILE - Write the message to a file. This requires an already establish open file handle
- _CRTDBG_MODE_WNDW - Display it in a message box with Abort, Retry and Ignore buttons
- _CRTDBG_REPORT_MODE - Returns the current setting for reportMode for each of the above report types
The thing to keep in mind with this mechanism is that each report type (warn, error, assert) has a separate reporting mode. In other words for each report type to have a separate value you would need to call _CrtSetReportMode three times with the reportMode flags.
For example, let's say you only want error messages to go to a file and the trace window but you want all warnings to go to just the trace window. You also want all asserts to be put in a message box in addition to the error file and the output window. This is how you would accomplish this.
#include
void AssignReportingLevels()
{
    _CrtSetReportMode( _CRT_WARN, _CRTDBG_MODE_DEBUG);
    _CrtSetReportMode( _CRT_ERROR, , _CRTDBG_MODE_DEBUG | _CRTDBG_MODE_FILE );
    _CrtSetReportMode( _CRT_ASSERT, _CRTDBG_MODE_DEBUG |_CRTDBG_MODE_FILE | _CRTDBG_MODE_WNDW );
}
_CrtSetReportFile is fairly simple to understand once you understand how to use _CrtSetReportMode. It has two parameters:
int ireportType - Report to apply the file to
_HFILE reportFile - A file handle to an open file to report messages to
Referring to our previous example, let's say we want the error file and the assert file to be separate. We obviously need to open two file handles, one for the error report and one for the assert report. Assuming that we have done that, here is the code below to assign them:
#include
extern _HFILE fileErrorReport;
extern _HFILE fileAssertReport;
void AssignReportFiles()
{
    _CrtSetReportFile(_CRT_ERROR,fileErrorReport);
    _CrtSetReportFile(_CRT_ASSERT,fileAssertReport);
}
PART 6: Remote Debugging
How do you deal with a bug you can reproduce only on a test machine? Remote debugging to the rescue--discover how to debug a program on one machine with a debugger on another.Remote Debugging
NOTE: Remote Debugging capability is not available in Visual Studio 2005/2008 Express. It also does not work on Windows XP Home edition, you willget an error saying "Not supported on this edition of Windows."
There are two terms will be used in this tutorial:
Target Machine - The computer that is running the remote debugging server and the application/process that needs to be debugged.
Host Machine - The machine that is running the Visual Studio debugger
the process is running locally.
The beauty of this is that you do not have to have Visual Studio installed on the machine just to debug the application, you can do it remotely
on another machine that does have Visual Studio installed. This kind of isolates the machine from any issues associated with installing Visual
Studio, for example, it could eliminate the issue of testing installation dependencies where maybe a DLL is included with Visual Studio but is not
natively included with the operating system installation. These are the kinds of reasons you might want to run an application on a untouched box.
Before you begin, make sure that your application is over on the target machine, while your program database file (commonly called <filename>.pdb)
is located on the host machine; this file contains symbol information that the debugger will need to load once it attaches to the process. Also make
sure that the executable you copy over is a binary match to the build of your source code, otherwise your debugger will not be synchronized and
there will be all sorts of problems tracing through the code. This problem will exhibit itself as things like breakpoints not lining up and the watch
variables not being valid. To set up a remote debugging session, you first need to copy the debug server over to the target machine. Find the folder under your installation
[drive]:\Program Files\Microsoft Visual Studio 9.0\Common7\IDE\Remote Debugger.
Copy this entire directory to the target machine that is running the process you would like to debug. You can put it in a directly anywhere on the drive.
Launch your application. Next, go into the directory you put the remote debugger in and launch msvsmon.exe.
When you run this you may get some dialog that pop up that indicate your Sharing and security model is set for guest, just click Yes.

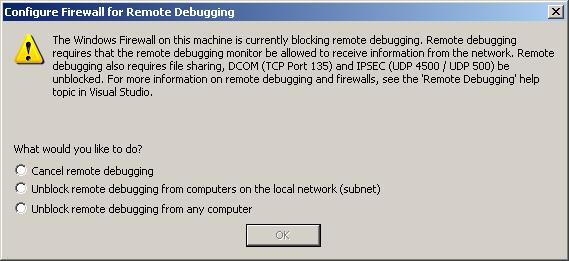
Next you may or may not get a dialog indicating that a firewall is blocking the debugger server or that you need to enable remote file sharing. Select either the second or third option and click OK.
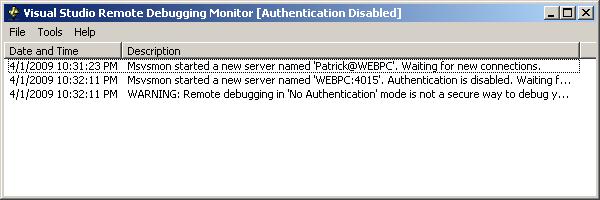
The next thing you need to do once it is running is to go to Tools/Options. Where the group box says Authentication Mode, select No Authentication, click on Allow any user to debug and click OK. Now the status screen show that there is no authentication. If you are REALLY concerned about running securely you can set all this up with a proper authorized windows account but since normally you would probably be running on a secure local network there really is no need to run securely in the debugger.

On your host machine in Visual Studio go to Tools->Attach to process (Ctrl-Alt-P) and open up the Attach to Process dialog. Change the Transport to Remote (Native only with no authentication). Next where it says .Qualifier. you're going to have to click the Browse button to
search for your target machine on the network Once you find your target machine the Attach to Process dialog will refresh with the
processes that are running on the other system.

Thats about it. Happy debugging !


 1万+
1万+

 被折叠的 条评论
为什么被折叠?
被折叠的 条评论
为什么被折叠?
 到【灌水乐园】发言


