


ab工具-压力测试工具
一、关于压力测试的部分概念:
1、吞吐率(Requests per second)
概念:服务器并发处理能力的量化描述,单位是reqs/s,指的是某个并发用户数下单位时间内处理的请求数。某个并发用户数下单位时间内能处理的最大请求数,称之为最大吞吐率。
计算公式:总请求数 / 处理完成这些请求数所花费的时间,即
Request per second = Complete requests / Time taken for tests
2、并发连接数(The number of concurrent connections)
概念:某个时刻服务器所接受的请求数目,简单的讲,就是一个会话。
3、并发用户数(The number of concurrent users,Concurrency Level)
概念:要注意区分这个概念和并发连接数之间的区别,一个用户可能同时会产生多个会话,也即连接数。
4、用户平均请求等待时间(Time per request)
计算公式:处理完成所有请求数所花费的时间/ (总请求数 / 并发用户数),即
Time per request = Time taken for tests /( Complete requests / Concurrency Level)
5、服务器平均请求等待时间(Time per request: across all concurrent requests)
计算公式:处理完成所有请求数所花费的时间 / 总请求数,即
Time taken for / testsComplete requests
可以看到,它是吞吐率的倒数。
同时,它也=用户平均请求等待时间/并发用户数,即:Time per request / Concurrency Level
二、ab工具简介
ab全称为:apache bench
-
在官网上的解释如下:
ab是Apache超文本传输协议(HTTP)的性能测试工具。其设计意图是描绘当前所安装的Apache的执行性能,主要是显示你安装的Apache每秒可以处理多少个请求。
-
其他网站解释:
ab是apache自带的压力测试工具。ab非常实用,它不仅可以对apache服务器进行网站访问压力测试,也可以对或其它类型的服务器进行压力测试。比如nginx、tomcat、IIS等。
以windows环境下,apache安装路径为C:\apache\Apache24\为例
打开终端,输入命令 cd C:\apache\Apache24\bin
即可启动ab
三、ab工具测试
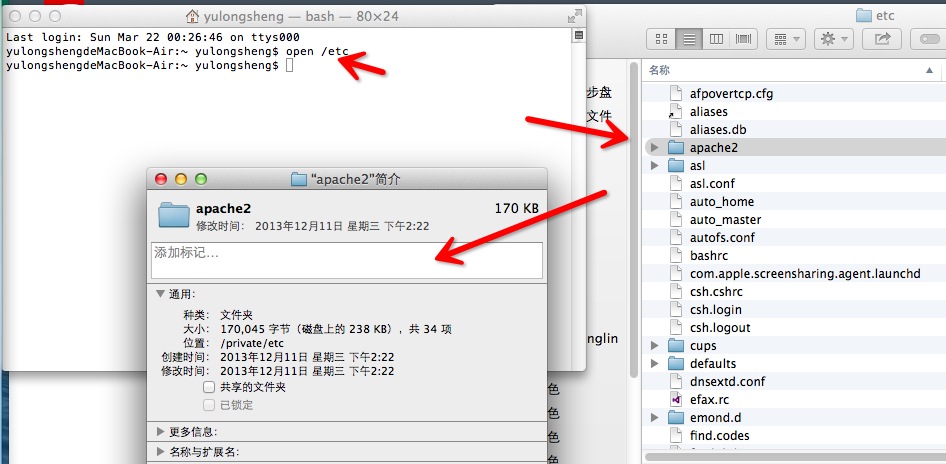
(1)找到apache藏身之所
系统默认是隐藏apache安装目录的,但我们可以通过“命令行”或者“文件夹前往”的方式找到它。它是安装在系统的私有目录下,也就是/private/etc下面,因为它是隐藏的,所以我们无法通过界面找到它。
ps:/ect目录是mac os 系统存放系统配置信息的地方,里面都是xxx.conf的配置文件。
在终端输入 open /etc 命令即可打开它的“住所”了。如图:
(2)apache下部署web资源
跟windows不一样,它的部署包不是放在htdocs(windows下的存放目录),而是放在 “/资源库/WebServer/Documents/”下面:
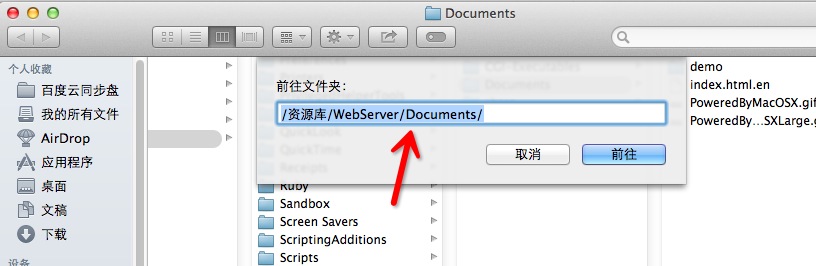
那么我们的静态资源就可以丢到这个目录下去了。
(3)修改默认部署路径
这个目录是apache的默认目录,有时候为了方便操作,可能需要指向特定的文件夹,该如何修改apache的配置呢?
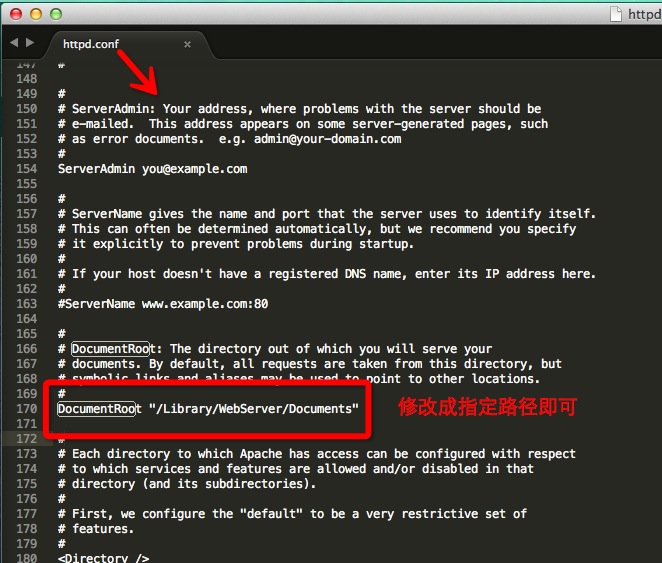
找到下面httpd.conf文件,配置转发,模块启动停用之类操作都在该文件里面。
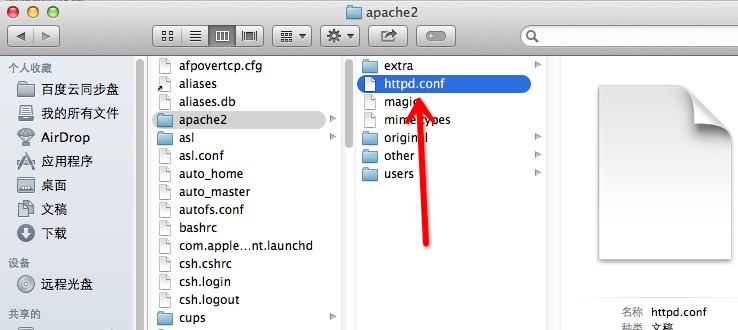
找到这个DocumentRoot,修改成你想要的地址即可。
(4)启动停用apache
启用apache的命令: sudo apachectl start/restart
如果需要password,输入即可,如果启动失败了,就可以去看apache的日志,找到错误的原因(前提是在httpd.conf中配置了日志的路径)
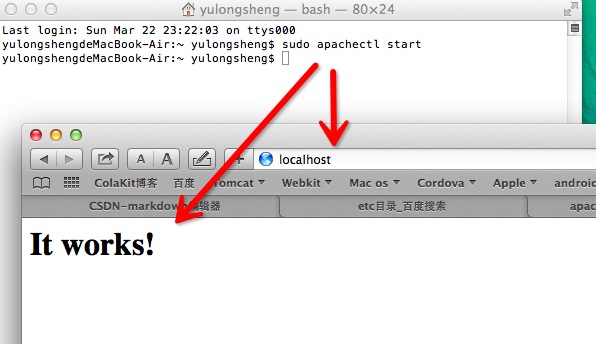
在浏览器中输入localhost或者127.0.0.1即可看到“It works!”的提示。恭喜,apache启动成功了。停止apache的命令是:sudo apachectl stop。
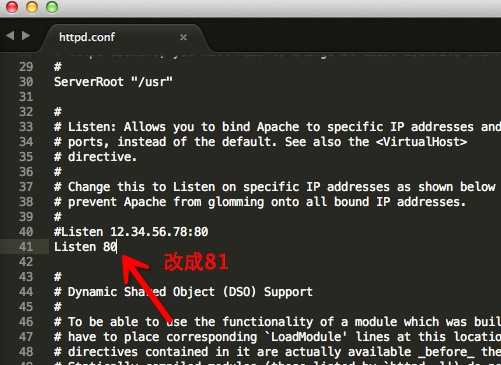
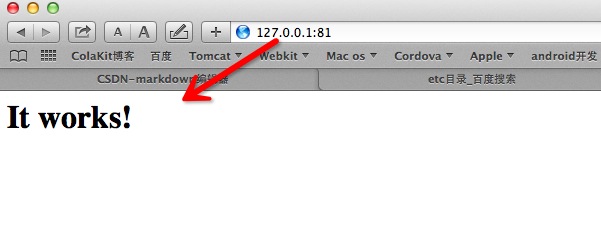
(5)修改apache默认端口
通过localhost或者127.0.0.1访问,表示默认的端口是80,有时候如果80端口被占用了,就得换个端口试试了。同样是在httpd.conf下面,找到Listen 80 那一行,修改成你想要的端口即可。
四、ab工具测试
在启动了ab工具的前提下:并发数要小于等于请求数。
(1)命令行:
-n requests Number of requests to perform , 用于指定压力测试总共的执行次数。
-c concurrency Number of multiple requests to make at a time ,用于指定压力测试的并发数。
-t timelimit Seconds to max. to spend on benchmarking
This implies -n 50000,,等待响应的最大时间(单位:秒)。
-s timeout Seconds to max. wait for each response
Default is 30 seconds
-b windowsize Size of TCP send/receive buffer, in bytes ,TCP发送/接收的缓冲大小(单位:字节)。
-B address Address to bind to when making outgoing connections
-p postfile File containing data to POST. Remember also to set -T ,发送POST请求时需要上传的文件,此外还必须设置-T参数。
-u putfile File containing data to PUT. Remember also to set -T ,发送PUT请求时需要上传的文件,此外还必须设置-T参数。
-T content-type Content-type header to use for POST/PUT data, eg.
'application/x-www-form-urlencoded'
Default is 'text/plain' 即content-type,用于设置Content-Type请求头信息,例如:application/x-www-form-urlencoded,默认值为text/plain。
-v verbosity How much troubleshooting info to print 即verbosity,指定打印帮助信息的冗余级别。
-w Print out results in HTML tables , 以HTML表格形式打印结果。
-i Use HEAD instead of GET ,使用HEAD请求代替GET请求。
-x attributes String to insert as table attributes ,插入字符串作为table标签的属性。
-y attributes String to insert as tr attributes ,插入字符串作为tr标签的属性。
-z attributes String to insert as td or th attributes ,插入字符串作为td标签的属性。
-C attribute Add cookie, eg. 'Apache=1234'. (repeatable) ,添加cookie信息,例如:"Apache=1234"(可以重复该参数选项以添加多个)。
-H attribute Add Arbitrary header line, eg. 'Accept-Encoding: gzip'
Inserted after all normal header lines. (repeatable) ,添加任意的请求头,例如:"Accept-Encoding: gzip",请求头将会添加在现有的多个请求头之后(可以重复该参数选项以添加多个)。
-A attribute Add Basic WWW Authentication, the attributes ,添加一个基本的网络认证信息,用户名和密码之间用英文冒号隔开。
are a colon separated username and password.
-P attribute Add Basic Proxy Authentication, the attributes
are a colon separated username and password. ,添加一个基本的代理认证信息,用户名和密码之间用英文冒号隔开。
-X proxy:port Proxyserver and port number to use ,指定使用的代理服务器和端口号,例如:"126.10.10.3:88"。
-V Print version number and exit ,打印版本号并退出。
-k Use HTTP KeepAlive feature ,使用HTTP的KeepAlive特性。
-d Do not show percentiles served table. ,不显示百分比。
-S Do not show confidence estimators and warnings. 不显示预估和警告信息。
-q Do not show progress when doing more than 150 requests
-l Accept variable document length (use this for dynamic pages)
-g filename Output collected data to gnuplot format file. 输出结果信息到gnuplot格式的文件中。
-e filename Output CSV file with percentages served ,输出结果信息到CSV格式的文件中。
-r Don't exit on socket receive errors. 指定接收到错误信息时不退出程序。
-m method Method name
-h Display usage information (this message) 显示用法信息,其实就是ab -help。
-Z ciphersuite Specify SSL/TLS cipher suite (See openssl ciphers)
-f protocol Specify SSL/TLS protocol
(SSL2, SSL3, TLS1 or ALL)
(2)测试命令行的格式:
ab [options] [http[s]://]hostname[:port]/path
标注:options是命令行 ,[http[s]://]hostname[:port]/path是需测试网址。
例如:ab -n 1000 -c 100 http://baidu.com/
(3)终端测试结果:

Concurrency Level: 100
//并发请求数
Time taken for tests: 50.872 seconds
//整个测试持续的时间
Complete requests: 1000
//完成的请求数
Failed requests: 0
//失败的请求数
Total transferred: 13701482 bytes
//整个场景中的网络传输量
HTML transferred: 13197000 bytes
//整个场景中的HTML内容传输量
Requests per second: 19.66 [#/sec] (mean)
//吞吐率,大家最关心的指标之一,相当于 LR 中的每秒事务数,后面括号中的 mean 表示这是一个平均值
Time per request: 5087.180 [ms] (mean)
//用户平均请求等待时间,大家最关心的指标之二,相当于 LR 中的平均事务响应时间,后面括号中的 mean 表示这是一个平均值
Time per request: 50.872 [ms] (mean, across all concurrent requests)
//服务器平均请求处理时间,大家最关心的指标之三
Transfer rate: 263.02 [Kbytes/sec] received
//平均每秒网络上的流量,可以帮助排除是否存在网络流量过大导致响应时间延长的问题
这段表示网络上消耗的时间的分解:

这段是每个请求处理时间的分布情况,50%的处理时间在4930ms内,66%的处理时间在5008ms内...,重要的是看90%的处理时间。
注意:在上面的压力测试中,Apache使用的是默认配置,并没有经过任何优化措施处理。实际上,Apache在经过配置优化后,只要服务器硬件够用,Apache服务器是能够撑起1000的并发量的。
五、关于登录的问题
有时候进行压力测试需要用户登录,怎么办?
请参考以下步骤:
-
- 先用账户和密码登录后,用开发者工具找到标识这个会话的Cookie值(Session ID)记下来
-
如果只用到一个Cookie,那么只需键入命令:
ab -n 100 -C key=value http://test.com/如果需要多个Cookie,就直接设Header:
ab -n 100 -H “Cookie: Key1=Value1; Key2=Value2” http://test.com/
六、总结
总的来说ab工具ab小巧简单,上手学习较快,可以提供需要的基本性能指标,但是没有图形化结果,不能监控。因此ab工具可以用作临时紧急任务和简单测试。
同类型的压力测试工具还有:webbench、siege、http_load等
参考:
http://www.jianshu.com/p/43d04d8baaf7
http://blog.csdn.net/seafishyls/article/details/44546809


 876
876

 被折叠的 条评论
为什么被折叠?
被折叠的 条评论
为什么被折叠?
 到【灌水乐园】发言


