


在学习ab工具之前,我们需了解几个关于压力测试的概念
吞吐率(Requests per second)
概念:服务器并发处理能力的量化描述,单位是reqs/s,指的是某个并发用户数下单位时间内处理的请求数。某个并发用户数下单位时间内能处理的最大请求数,称之为最大吞吐率。
计算公式:总请求数 / 处理完成这些请求数所花费的时间,即
Request per second = Complete requests / Time taken for tests
并发连接数(The number of concurrent connections)
概念:某个时刻服务器所接受的请求数目,简单的讲,就是一个会话。
并发用户数(The number of concurrent users,Concurrency Level)
概念:要注意区分这个概念和并发连接数之间的区别,一个用户可能同时会产生多个会话,也即连接数。
用户平均请求等待时间(Time per request)
计算公式:处理完成所有请求数所花费的时间/ (总请求数 / 并发用户数),即
Time per request = Time taken for tests /( Complete requests / Concurrency Level)
服务器平均请求等待时间(Time per request: across all concurrent requests)
计算公式:处理完成所有请求数所花费的时间 / 总请求数,即
Time taken for / testsComplete requests
可以看到,它是吞吐率的倒数。
同时,它也=用户平均请求等待时间/并发用户数,即
Time per request / Concurrency Level
ab工具简介
ab是apache自带的压力测试工具。ab非常实用,它不仅可以对apache服务器进行网站访问压力测试,也可以对或其它类型的服务器进行压力测试。比如nginx、tomcat、IIS等。
安装:
ycz@ubuntu:~$ ab
程序“ab”尚未安装。 您可以使用以下命令安装:
sudo apt-get install apache2-utils
ycz@ubuntu:~$ sudo apt-get install apache2-utils
参数列表:

Usage: ab [options] [http[s]://]hostname[:port]/path
Options are:
-n requests Number of requests to perform //请求链接数
-c concurrency Number of multiple requests to make at a time //表示并发数
-t timelimit Seconds to max. to spend on benchmarking
This implies -n 50000
-s timeout Seconds to max. wait for each response
Default is 30 seconds
-b windowsize Size of TCP send/receive buffer, in bytes
-B address Address to bind to when making outgoing connections
-p postfile File containing data to POST. Remember also to set -T
-u putfile File containing data to PUT. Remember also to set -T
-T content-type Content-type header to use for POST/PUT data, eg.
'application/x-www-form-urlencoded'
Default is 'text/plain'
-v verbosity How much troubleshooting info to print
-w Print out results in HTML tables
-i Use HEAD instead of GET
-x attributes String to insert as table attributes
-y attributes String to insert as tr attributes
-z attributes String to insert as td or th attributes
-C attribute Add cookie, eg. 'Apache=1234'. (repeatable)
-H attribute Add Arbitrary header line, eg. 'Accept-Encoding: gzip'
Inserted after all normal header lines. (repeatable)
-A attribute Add Basic WWW Authentication, the attributes
are a colon separated username and password.
-P attribute Add Basic Proxy Authentication, the attributes
are a colon separated username and password.
-X proxy:port Proxyserver and port number to use
-V Print version number and exit
-k Use HTTP KeepAlive feature
-d Do not show percentiles served table.
-S Do not show confidence estimators and warnings.
-q Do not show progress when doing more than 150 requests
-l Accept variable document length (use this for dynamic pages)
-g filename Output collected data to gnuplot format file.
-e filename Output CSV file with percentages served
-r Don't exit on socket receive errors.
-h Display usage information (this message)
-Z ciphersuite Specify SSL/TLS cipher suite (See openssl ciphers)
-f protocol Specify SSL/TLS protocol
(SSL3, TLS1, TLS1.1, TLS1.2 or ALL)
开始测试
输入命令
ycz@ubuntu:~$ ab -n 100 -c 10 http://sewise.21321.com/redistest/RedisSaveToMysqlJson
其中-n表示请求数,-c表示并发数
请求测试代码:$redisInfo 是一个Json数组

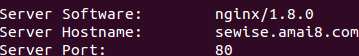
这段展示的是web服务器的信息,可以看到服务器采用的是nginx,域名是wan.bigertech.com,端口是80
这段是关于请求的文档的相关信息,所在位置“/”,文档的大小为338436 bytes(此为http响应的正文长度)

这段展示了压力测试的几个重要指标
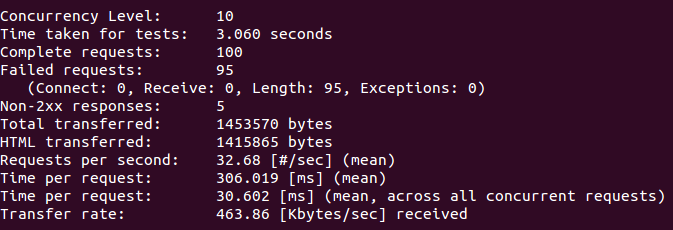
Concurrency Level: 100 //并发请求数
Time taken for tests: 50.872 seconds //整个测试持续的时间
Complete requests: 1000 //完成的请求数
Failed requests: 0 //失败的请求数
Total transferred: 13701482 bytes //整个场景中的网络传输量
HTML transferred: 13197000 bytes //整个场景中的HTML内容传输量
Requests per second: 19.66 [#/sec] (mean) //吞吐率,大家最关心的指标之一,相当于 LR 中的每秒事务数,后面括号中的 mean 表示这是一个平均值
Time per request: 5087.180 [ms] (mean) //用户平均请求等待时间,大家最关心的指标之二,相当于 LR 中的平均事务响应时间,后面括号中的 mean 表示这是一个平均值
Time per request: 50.872 [ms] (mean, across all concurrent requests) //服务器平均请求处理时间,大家最关心的指标之三
Transfer rate: 263.02 [Kbytes/sec] received //平均每秒网络上的流量,可以帮助排除是否存在网络流量过大导致响应时间延长的问题
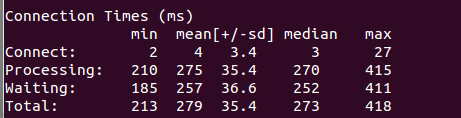
这段表示网络上消耗的时间的分解
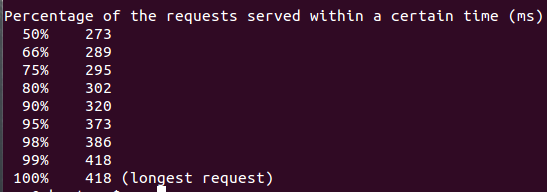
这段是每个请求处理时间的分布情况,50%的处理时间在273ms内,66%的处理时间在289ms内...,重要的是看90%的处理时间。
关于登录的问题
有时候进行压力测试需要用户登录,怎么办?
请参考以下步骤:
先用账户和密码登录后,用开发者工具找到标识这个会话的Cookie值(Session ID)记下来
如果只用到一个Cookie,那么只需键入命令:
ab -n 100 -C key=value http://test.com/
如果需要多个Cookie,就直接设Header:
ab -n 100 -H “Cookie: Key1=Value1; Key2=Value2” http://test.com/
总结
总的来说ab工具ab小巧简单,上手学习较快,可以提供需要的基本性能指标,但是没有图形化结果,不能监控。因此ab工具可以用作临时紧急任务和简单测试。
同类型的压力测试工具还有:webbench、siege、http_load等
参考网址:http://www.jianshu.com/p/43d04d8baaf7


 876
876


 被折叠的 条评论
为什么被折叠?
被折叠的 条评论
为什么被折叠?
 到【灌水乐园】发言


