


转自:https://www.awaimai.com/1659.html
XDebug的性能分析功能会输出一堆数据文件,这些文件如果手动查看,很难筛选出有用信息。
而Webgrind则可以解析XDebug数据,显示在浏览器上。
所以这两个工具结合起来,可以快捷的分析PHP程序。
1 安装和配置XDebug
这一步相对简单,请参考:XDebug安装和配置教程。
其中Profiler部分配置如下:
xdebug.profiler_enable = 1
xdebug.profiler_enable_trigger = 1
xdebug.profiler_output_dir = "/tmp/xdebug"
xdebug.profiler_output_name = "out.%t-%s"
2 为Webgrind配置站点
新建一个目录,作为Webgrind的代码目录:
$ mkdir /home/www/webgrind
打开Nginx配置文件,添加一个站点,
server {
    listen 80;

    root /home/www/webgrind;
    server_name webgrind.dev.com;
    index index.php;

    access_log /var/log/nginx/webgrind.log;

    location / {
        index index.php;
        try_files $uri $uri/ /index.php?$args;
    }

    location ~ .*\.(php|php5)?$ {
        fastcgi_pass 127.0.0.1:9000;
        fastcgi_param SCRIPT_FILENAME $document_root$fastcgi_script_name;
        fastcgi_index index.php;
        include fastcgi_params;
        client_max_body_size 30M;
        client_body_temp_path /data;
    }
}
然后修改host文件,指向到 webgrind.dev.com 。
3 安装Webgrind源码
Webgrind项目的地址为:https://github.com/jokkedk/webgrind。
用git复制项目源码:
cd /home/www/webgrind
git clone https://github.com/jokkedk/webgrind.git ./
打开目录下的config.php文件,两个变量修改为如下值:
 static $storageDir = '/tmp/xdebug';
 static $profilerDir = '/tmp/xdebug';
这两个配置和php.ini中的路径一致。
4 开始分析
重启Nginx和PHP-FPM,
$ sudo service nginx restart
$ sudo service php-fpm restart
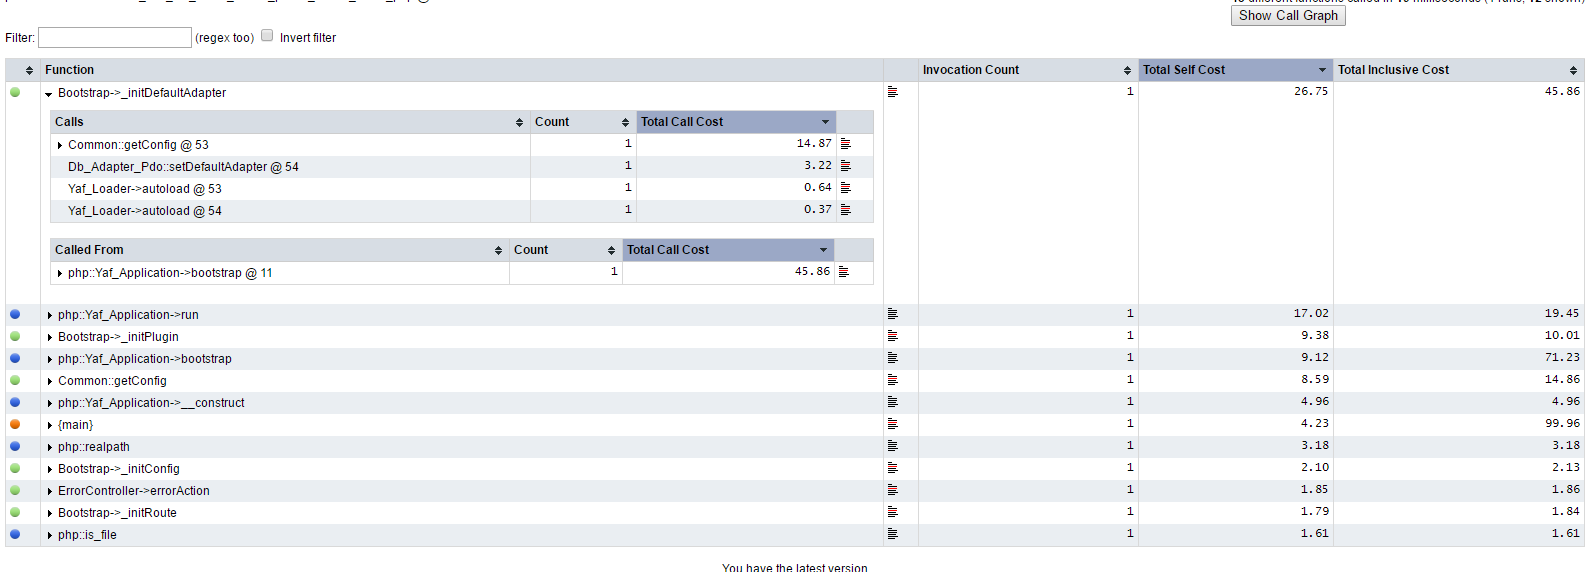
访问新配置的站点URL:webgrind.dev.com
可以看到如下的图形,即可分析出函数的耗时和调用关系。
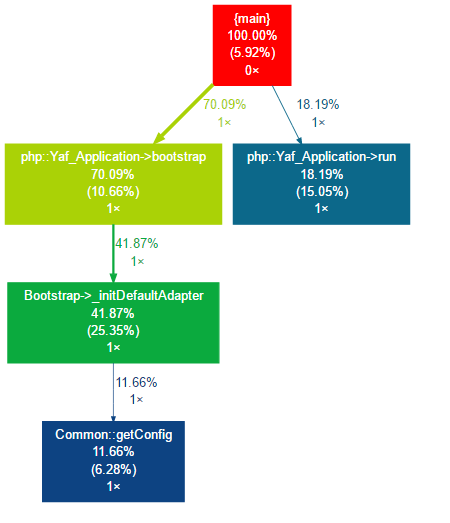
5 图形调用关系
要打开图形调用关系,需先安装
$ sudo yum install graphviz
然后点击右上角的Show Call Graph,就可以打开如下图调用关系。


 107
107


 被折叠的 条评论
为什么被折叠?
被折叠的 条评论
为什么被折叠?
 到【灌水乐园】发言


