


概述
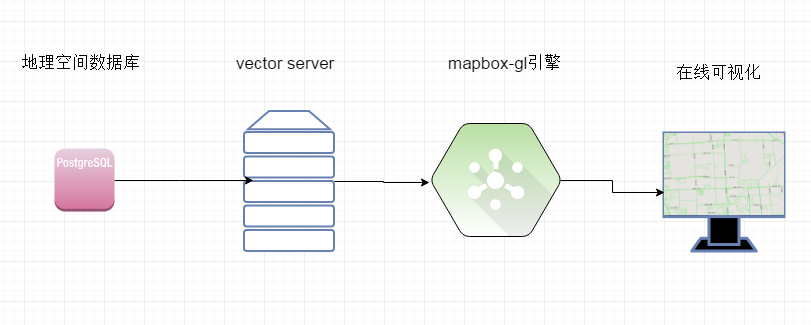
本文旨在从无到erverything的部署一套在线可视化的矢量地图,当然是依赖于mapbox-gl,物理流程图如下:
条件
js方面:
1、mapbox-gl-dev.js,参考http://www.cnblogs.com/lilei2blog/p/7827110.html
2、字体符号,参考http://www.cnblogs.com/lilei2blog/p/7827193.html
数据库方面:
1、安装有postgis的postgresql数据库
2、加载存有空间地理数据的道路数据到postgresql数据库中,并对其建立空间索引
对postgis的操作参考我的博客:http://www.cnblogs.com/lilei2blog/p/7815253.html、http://www.cnblogs.com/lilei2blog/p/7814936.html
数据服务方面:
参考我的博客http://www.cnblogs.com/lilei2blog/p/7830945.html
步骤
该步我采用从数据->后台->前台的顺序来推进
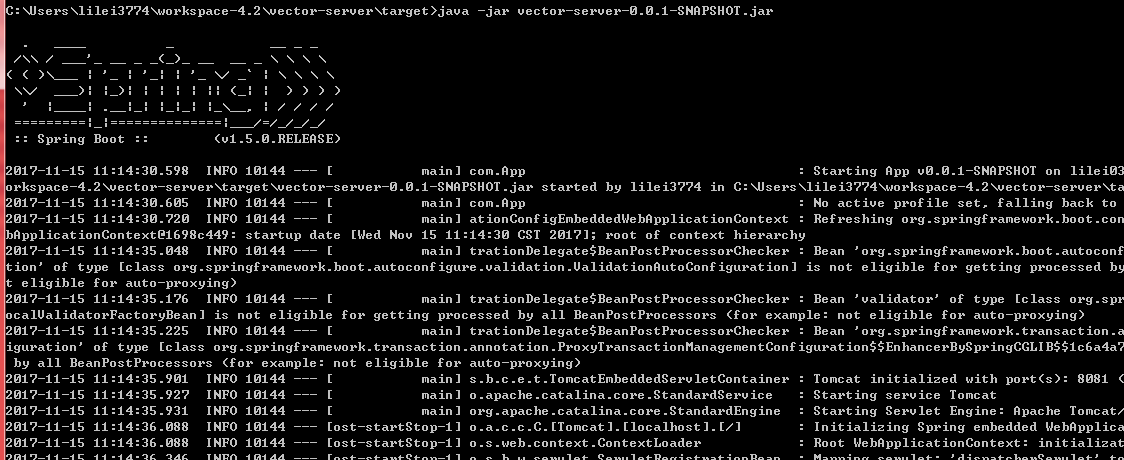
1、启动供应vector tile的服务
2、使用myeclipse建立一个java web工程new-mbg
3、拷贝编译好的mapbox-gl的dist目录拷贝到工程下
4、拷贝编译好的字体文件目录拷贝到工程下
5、可视化配置,mapbox-gl核心配置包括:
1、sources数据来源
2、sprite图标配置
3、layers 图层配置
4、glyphs字体配置
样例如下:
<!DOCTYPE html>
<html>
<head>
<meta charset='utf-8' />
<title>Display a map</title>
<meta name='viewport'
	content='initial-scale=1,maximum-scale=1,user-scalable=no' />
<script src='dist/mapbox-gl-dev.js'></script>
<link href='dist/mapbox-gl.css' rel='stylesheet' />
<style>
body {
	margin: 0;
	padding: 0;
}

#map {
	position: absolute;
	top: 0;
	bottom: 0;
	width: 100%;
}
</style>

<script type="text/javascript">
	var layers = [
			{
				"id" : "background",
				"type" : "background",
				"layout" : {

				},
				"paint" : {
					"background-color" : {
						"base" : 1,
						"stops" : [ [ 11, "hsl(35, 32%, 91%)" ],
								[ 13, "hsl(35, 12%, 89%)" ] ]
					}
				}
			}, {
				"interactive" : true,
				"layout" : {
					"visibility" : "visible",
					"line-cap" : "round",
					"line-join" : "round"
				},
				"type" : "line",
				"source" : "composite",
				"id" : "id1",
				"paint" : {
					"line-width" : {
						"base" : 3.5,
						"stops" : [ [ 5, 0.75 ], [ 18, 32 ] ]
					},
					"line-color" : "#00ee00"
				},
				"source-layer" : "link"
			}, {
				"id" : "road-label-medium",
				"type" : "symbol",
				"metadata" : {
					"mapbox:group" : "1444933721429.3076"
				},
				"source" : "composite",
				"source-layer" : "link",
				"minzoom" : 12,
				"layout" : {
					"text-size" : {
						"base" : 2,
						"stops" : [ [ 11, 10 ], [ 20, 14 ] ]
					},
					"text-max-angle" : 30,
					"symbol-spacing" : 250,
					"text-font" : [ "hwxk" ],
					"symbol-placement" : "line",
					"text-padding" : 1,
					"text-rotation-alignment" : "map",
					"text-field" : "{name}",
					"text-letter-spacing" : 0.01
				},
				"paint" : {
					"text-color" : "hsl(40, 0%, 0%)",
					"text-halo-color" : "hsl(0, 0%, 100%)",
					"text-halo-width" : 1
				}
			}

			 ]

	var simple = {
		"version" : 8,
		"name" : "Bright",
		"sources" : {
			"composite" : {
				"type" : "vector",
				"tiles" : [ "http://localhost:8081/link/{z}/{x}/{y}"]

			}
		},
		"sprite" : "http://localhost:8080/new-mbg/sprites/sprite",
		"glyphs" : "http://localhost:8080/new-mbg/glyphs/{fontstack}/{range}.pbf",
		"layers" : layers
	};
</script>
</head>
<body>

	<div id='map'></div>
	<script>
		var map = new mapboxgl.Map({
			container : 'map', // container id
			style : simple, // stylesheet location
			zoom : 13,
			center : [ 116.808037, 39.9752 ]
		});
	</script>

</body>
</html>
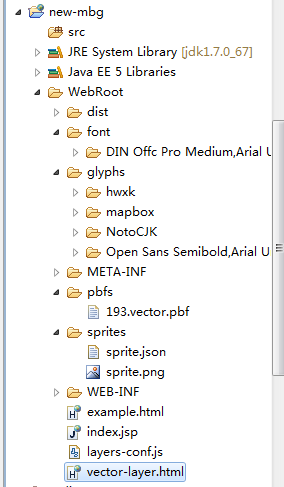
工程结构图如下:
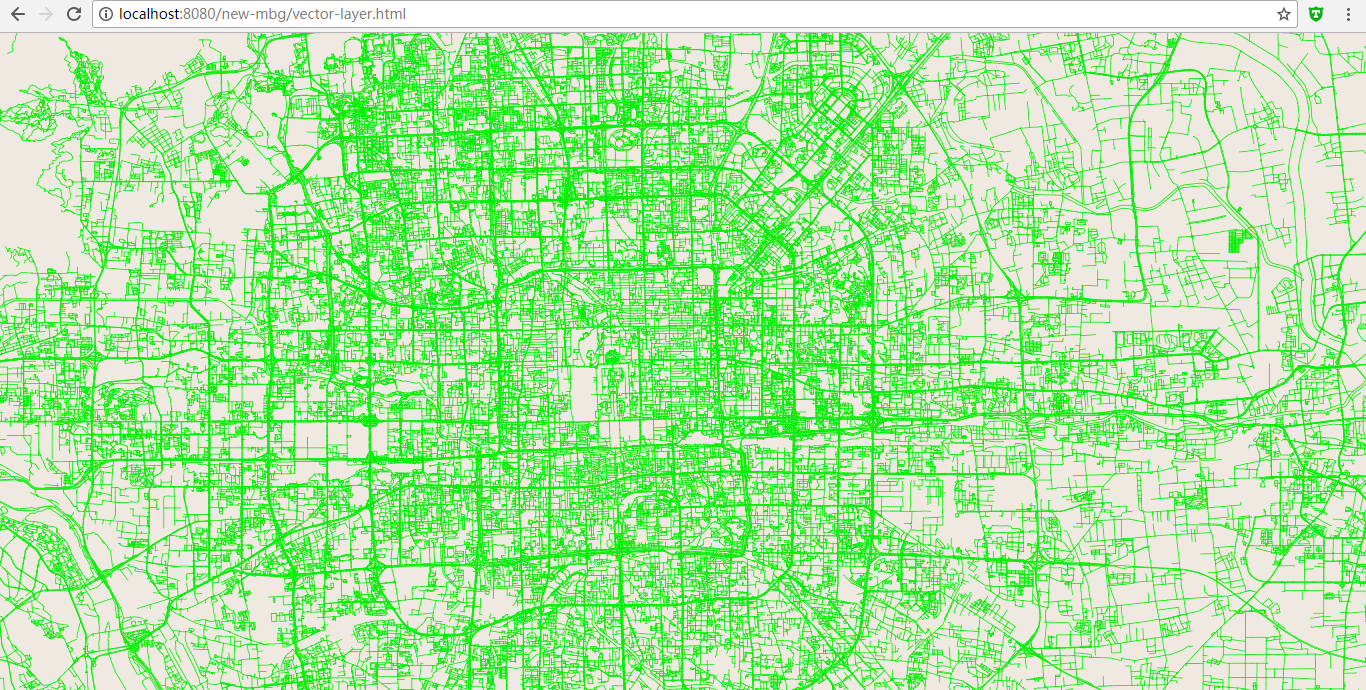
效果
北京道路:
工程git路径:https://github.com/lileialg/mapbox-gl-local


 1985
1985


 被折叠的 条评论
为什么被折叠?
被折叠的 条评论
为什么被折叠?
 到【灌水乐园】发言


