


分析 Android 应用Profiling Android Apps
04/03/2018
本文内容
在将应用部署到应用商店之前,必须先识别并修复任何性能瓶颈、过度占用内存或网络资源利用效率低下的问题。Before deploying your app to an app store, it's important to identify and fix any performance bottlenecks, excessive memory usage issues, or inefficient use of network resources. 可以使用两个探查器工具来实现此目的:Two profiler tools are available to serve this purpose:
Xamarin ProfilerXamarin Profiler
Android Studio 中的 Android ProfilerAndroid Profiler in Android Studio
本指南介绍了 Xamarin Profiler,并提供了有关如何开始使用 Android Profiler 的详细信息。This guide introduces the Xamarin Profiler and provides detailed information for getting started with using the Android Profiler.
Xamarin ProfilerXamarin Profiler
Xamarin Profiler 是独立的应用程序,与 Visual Studio 和 Visual Studio for Mac 集成,用于从 IDE 中分析 Xamarin 应用。The Xamarin Profiler is a standalone application that is integrated with Visual Studio and Visual Studio for Mac for profiling Xamarin apps from within the IDE. 有关使用 Xamarin Profiler 的详细信息,请参阅 Xamarin Profiler。For more information about using the Xamarin Profiler, see Xamarin Profiler.
备注
必须订阅 Visual Studio Enterprise 才能解锁 Windows 版 Visual Studio Enterprise 或 Visual Studio for Mac 中的 Xamarin Profiler 功能。You must be a Visual Studio Enterprise subscriber to unlock the Xamarin Profiler feature in either Visual Studio Enterprise on Windows or Visual Studio for Mac.
Android Studio ProfilerAndroid Studio Profiler
Android Studio 3.0 及更高版本含有 Android Profiler 工具。Android Studio 3.0 and later includes an Android Profiler tool. 可以使用 Android Profiler 来衡量使用 Visual Studio 生成的 Xamarin Android 应用的性能 – 而无需 Visual Studio Enterprise 许可证。You can use the Android Profiler to measure the performance of a Xamarin Android app built with Visual Studio – without the need for a Visual Studio Enterprise license. 但是,与 Xamarin Profiler 不同,Android Profiler 没有与 Visual Studio 集成,并且只能用于分析已提前生成并导入 Android Profiler 的 Android 应用程序包 (APK)。However, unlike the Xamarin Profiler, the Android Profiler is not integrated with Visual Studio and can only be used to profile an Android application package (APK) that has been built in advance and imported into the Android Profiler.
在 Android Profiler 中启动 Xamarin Android 应用Launching a Xamarin Android app in Android Profiler
下列步骤介绍如何在 Android Studio 的 Android Profiler 工具中启动 Xamarin Android 应用程序。The following steps explain how to launch an Xamarin Android application in Android Studio's Android Profiler tool. 在下面的示例屏幕截图中,Xamarin 窗体 XamagonXuzzle 应用是使用 Android Profiler 生成和分析的:In the example screenshots below, the Xamarin Forms XamagonXuzzle app is built and profiled using Android Profiler:
在 Android 项目生成选项中,禁用“使用共享运行时” 。In the Android project build options, disable Use Shared Runtime. 这可确保 Android 应用程序包 (APK) 的生成不依赖于共享开发时间 Mono 运行时。This ensures that the Android application package (APK) is built without a dependency on the shared development-time Mono runtime.

生成用于“调试”的应用,并将其部署到物理设备或仿真器中 。Build the app for Debug and deploy it to a physical device or emulator. 这可生成 APK 的已签名“调试”版本 。This causes a signed Debug version of the APK to be built.
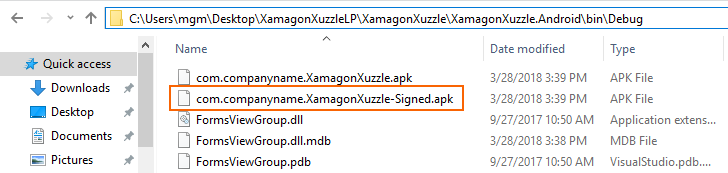
对于 XamagonXuzzle 示例,生成的 APK 名为 com.companyname.XamagonXuzzle Signed.apk 。For the XamagonXuzzle example, the resulting APK is named com.companyname.XamagonXuzzle-Signed.apk.
打开项目文件夹,然后导航到 bin/Debug 。Open the project folder and navigate to bin/Debug. 在此文件夹中,找到 Signed.apk 版本的应用并将其复制到易于访问的位置(例如桌面) 。In this folder, locate the Signed.apk version of the app and copy it to a conveniently-accessible place (such as the desktop). 在下面的屏幕截图中,已找到 APK com.companyname.XamagonXuzzle Signed.apk,并已将其复制到桌面 :In the following screenshot, the APK com.companyname.XamagonXuzzle-Signed.apk is located and copied to the desktop:
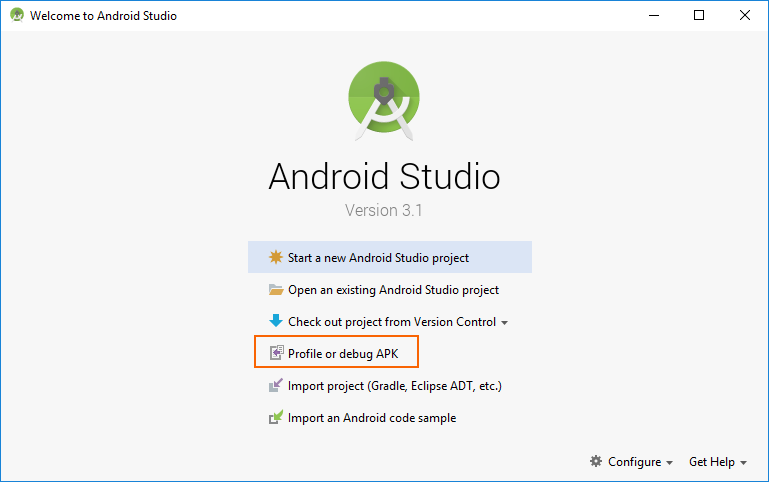
启动 Android Studio,然后选择“分析或调试 APK” :Launch Android Studio and select Profile or debug APK:
在“选择 APK 文件”对话框中,导航到先前生成和复制的 APK 。In the Select APK File dialog, navigate to the APK that you built and copied earlier. 选择 APK,然后单击“确定” :Select the APK and click OK:

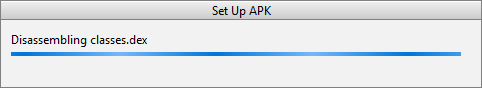
Android Studio 将加载 APK 并反汇编 classes.dex :Android Studio will load the APK and dissassembles classes.dex:
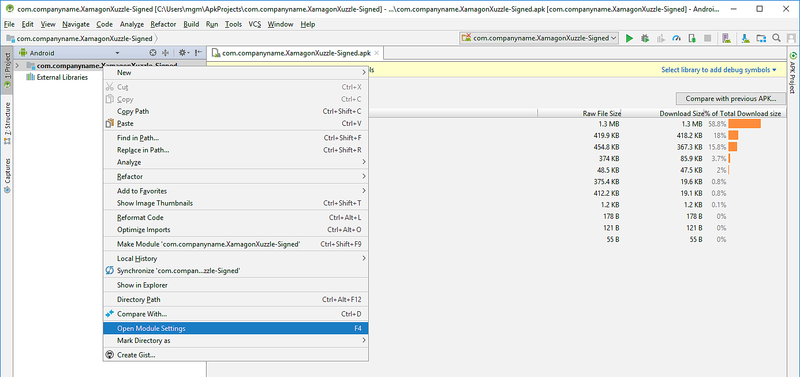
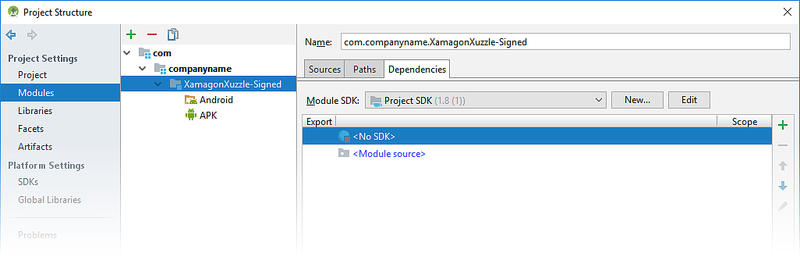
加载 APK 后,Android Studio 显示以下 APK 项目屏幕。After the APK is loaded, Android Studio displays the following project screen for the APK. 右键单击左侧树视图中的应用名称,然后选择“打开模块设置” :Right-click the app name in the tree view on the left and select Open Module Settings:
导航到“项目设置”>“模块”,选择应用的 -Signed 节点,然后单击“” :Navigate to Project Settings > Modules, select the -Signed node of the app, then click :
在“模块 SDK”下拉菜单中,选择用于生成应用的 Android SDK 级别(在此示例中,使用 API 级别 26 来生成 XamagonXuzzle) :In the Module SDK pull-down menu, select the Android SDK level that was used to build the app (in this example, API level 26 was used to build XamagonXuzzle):
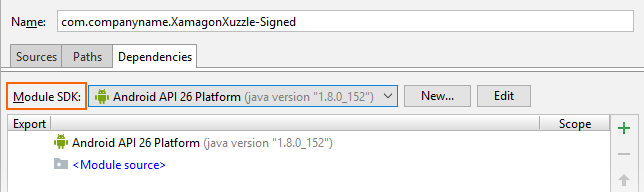
单击“应用”和“确定”保存此设置 。Click Apply and OK to save this setting.
从工具栏图标启动探查器:Launch the profiler from the toolbar icon:

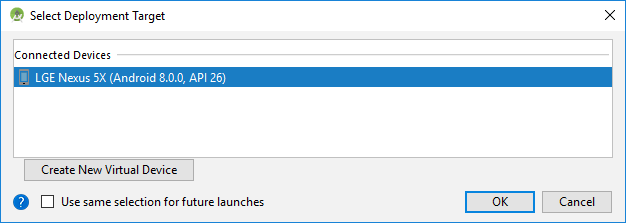
选择运行/分析应用的部署目标,然后单击“确定” 。Select the deployment target for running/profiling the app and click OK. 部署目标可以是物理设备,也可以是在仿真器中运行的虚拟设备。The deployment target can be a physical device or a virtual device running in an emulator. 此示例使用的是 Nexus 5X 设备:In this example, a Nexus 5X device is used:
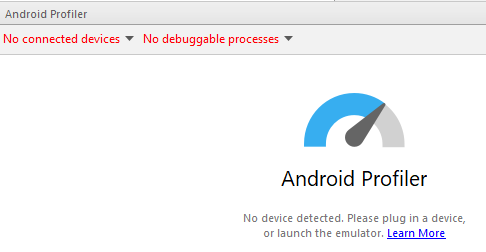
探查器启动后,需要几秒钟时间才能连接到部署设备和应用进程。After the profiler starts, it will take a few seconds for it to connect to the deployment device and the app process. 安装 APK 时,Android Profiler 将报告“无已连接设备”和“无可调试进程” 。While it is installing the APK, Android Profiler will report No connected devices and No debuggable processes.
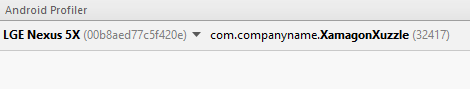
几秒钟后,Android Profiler 完成 APK 安装并启动 APK,报告正在分析的设备名称和应用进程名称(在此示例中,分别是 LGE Nexus 5X 和 com.companyname.XamagonXuzzle) :After several seconds, Android Profiler will complete APK installation and launch the APK, reporting the device name and the name of the app process being profiled (in this example, LGE Nexus 5X and com.companyname.XamagonXuzzle, respectively):
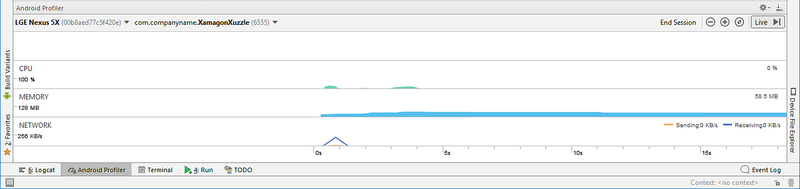
识别设备和可调试进程后,Android Profiler 开始分析应用:After the device and debuggable process are identified, Android Profiler begins profiling the app:
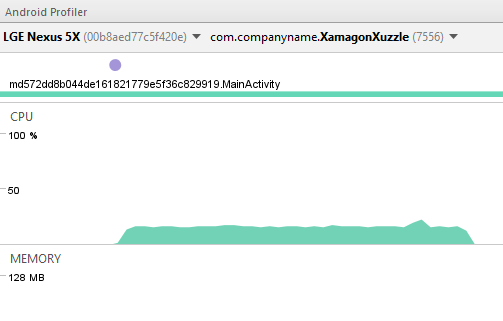
如果点击 XamagonXuzzle 上的“随机化”按钮(这会导致其移动和随机化磁贴),可看到 CPU 使用率在应用的随机化间隔期间增加 :If you tap the RANDOMIZE button on XamagonXuzzle (which causes it to shift and randomize tiles), you will see the CPU usage increase during the app's randomization interval:
使用 Android ProfilerUsing the Android Profiler
Android Studio 文档中记录了有关使用 Android Profiler 的详细信息。Detailed information for using the Android Profiler is included in the Android Studio documentation.
Xamarin Android 开发人员可能对以下主题感兴趣:The following topics will be of interest to Xamarin Android developers:
CPU Profiler – 说明如何实时检查应用的 CPU 使用情况和线程活动。CPU Profiler – Explains how to inspect the app's CPU usage and thread activity in real-time.
内存 Profiler – 显示应用内存使用情况的实时图,并包括记录内存分配以进行分析的按钮。Memory Profiler – Displays a real-time graph of the app's memory usage, and includes a button to record memory allocations for analysis.
网络 Profiler – 显示应用发送和接收的数据的实时网络活动。Network Profiler – Displays real-time network activity of data sent and received by the app.


 2531
2531


 被折叠的 条评论
为什么被折叠?
被折叠的 条评论
为什么被折叠?
 到【灌水乐园】发言


