


在工作中,除了对单独一个工作簿合并外,有时候有很多工作簿也需要合并,那么你就需要用到Power Query这个技能了。
2013版本以下需要在微软官方下载Power Query插件。
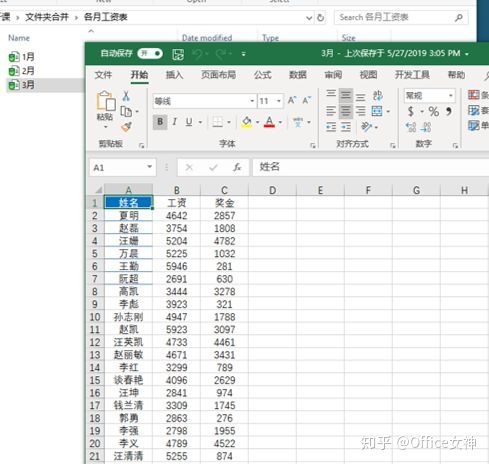
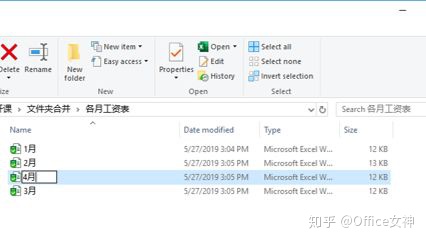
比如下图:有三个工作簿,在同一文件夹下,标题一致:
(以下步骤在office365中完成,其它版本略有不同)
第一步:数据—获取数据/新建查询—来自文件—从文件夹

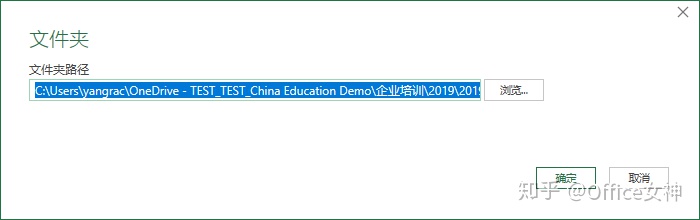
接着,找到文件夹所在的位置:
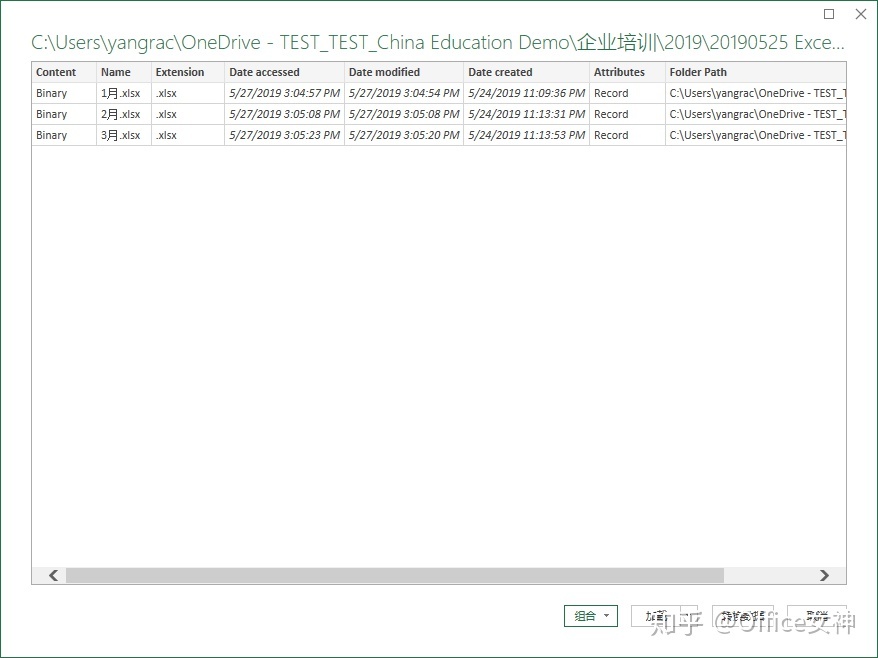
点击“转换数据”/“编辑”:
进入Power Query编辑器之后,我们需要添加一列,将工作簿的内容展开:添加列—自定义列—输入公式 “Excel.Workbook([Content])”。
注意:[Content] 是点击“插入”,不是手动输入。
所有的数据都在这个Table里面:
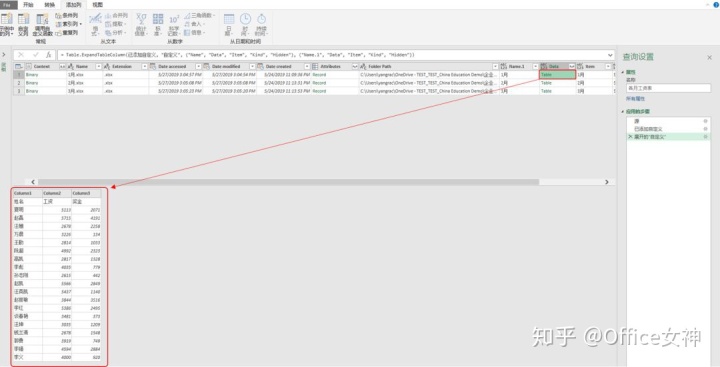
我们需要展开Table获取数据:
这个时候,我们只是打开了工作簿,还需要再打开工作表:
得到如下图:
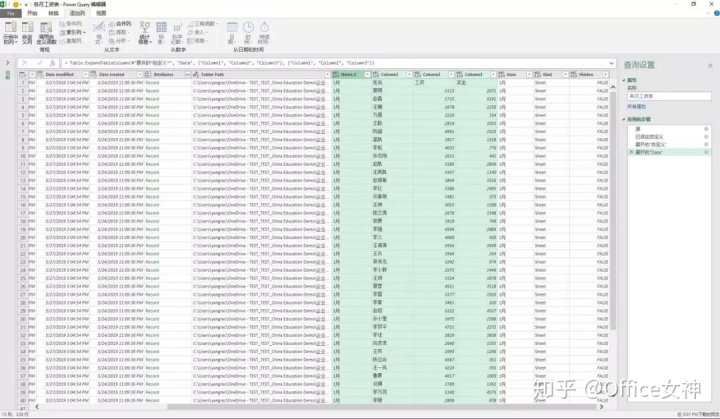
我们只需要保留工作表里的数据,选中不需要的列直接按Delete键就可以删除:
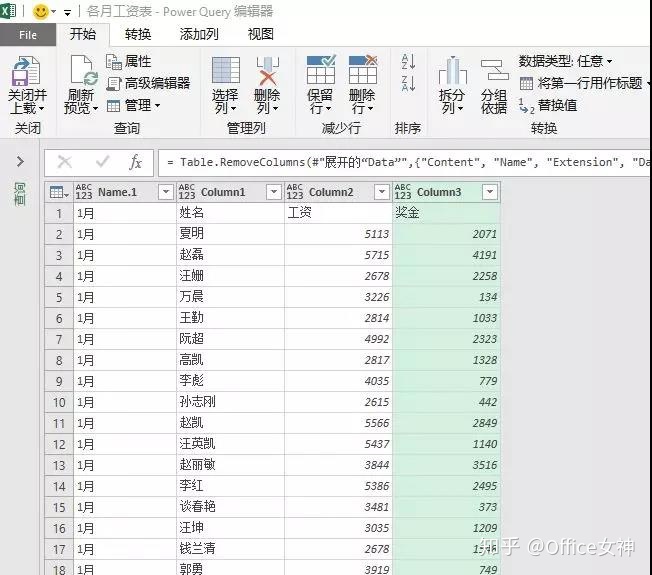
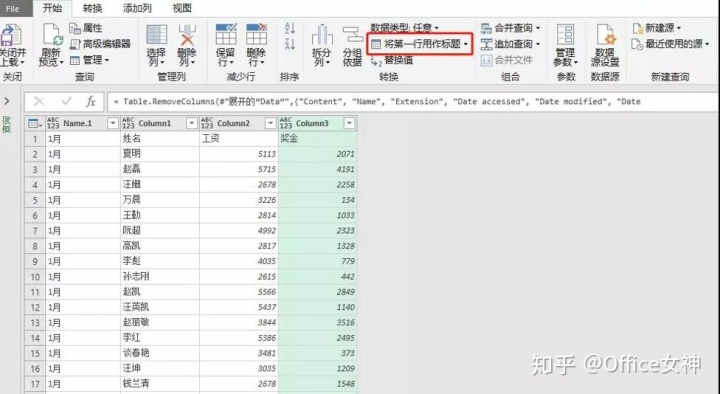
这时,我们要提升首行作为标题:
但是,上面的操作只是将第一个工作表的标题提升了,其它工作表的标题还存在,怎么办呢?
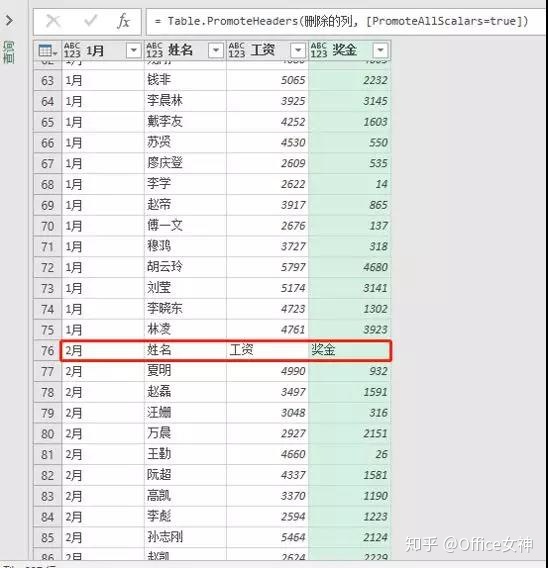
只需要将这些文字筛选掉就可以了:
最后修改一下标题,再上传到Excel中就OK了:
如果新增了工作簿:
你只需要点一下鼠标右键中的刷新就ok了:
再不用挨个打开工作簿复制粘贴到一个表了,只需要刷新,所以的工作簿都汇总在一起了。
So easy!


 570
570

 被折叠的 条评论
为什么被折叠?
被折叠的 条评论
为什么被折叠?
 到【灌水乐园】发言


