


I'm using the mpl_toolkits to plot surfaces in 3d using Axes3D and plot_surface.
I visualize the output in the following way,
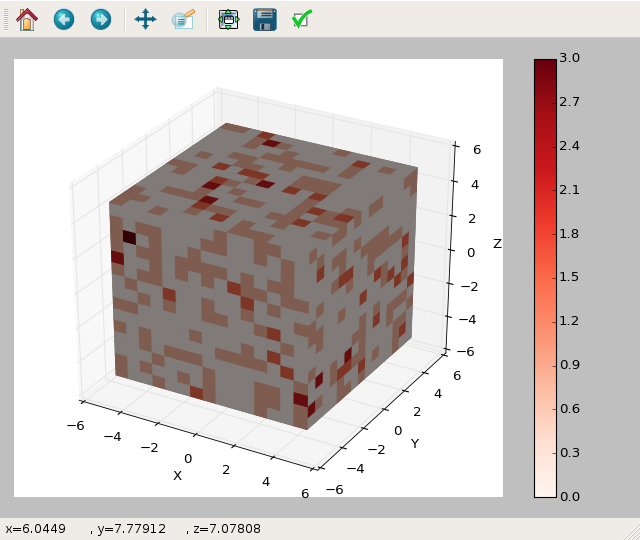
You can clearly see that there is a grey tint to the entire surface when the colors are supposed to resemble the colorbar on the right.
I see this behavior in several other plots out there doing similar things. For example here http://stackoverflow.com/a/20475233/2495342
I am using the latest anaconda distribution of python and running my code within spyder which uses the Qt4Agg backend. I get the same behavior under linux and windows. Using a different colormap does not help either. The visualization is always tinted grey.
I haven't found much help through google, so any help is appreciated.
Here is a quick demo
import numpy as np
from matplotlib import pyplot
from matplotlib import cm
from mpl_toolkits.mplot3d import Axes3D
X, Y = np.meshgrid(np.arange(-1, 1, 0.1), np.arange(-1, 1, 0.1))
Z = np.zeros_like(X)
F = np.sqrt(X**2 + Y**2)
F -= np.min(F)
F /= np.max(F)
fig = pyplot.figure()
ax = fig.gca(projection='3d')
ax.plot_surface(X, Y, Z, rstride=1, cstride=1, facecolors=cm.coolwarm(F))
Which returns

解决方案
use shade argument:
ax.plot_surface(X, Y, Z, rstride=1, cstride=1,
facecolors=cm.coolwarm(F), shade=False)


 1662
1662


 被折叠的 条评论
为什么被折叠?
被折叠的 条评论
为什么被折叠?
 到【灌水乐园】发言


