


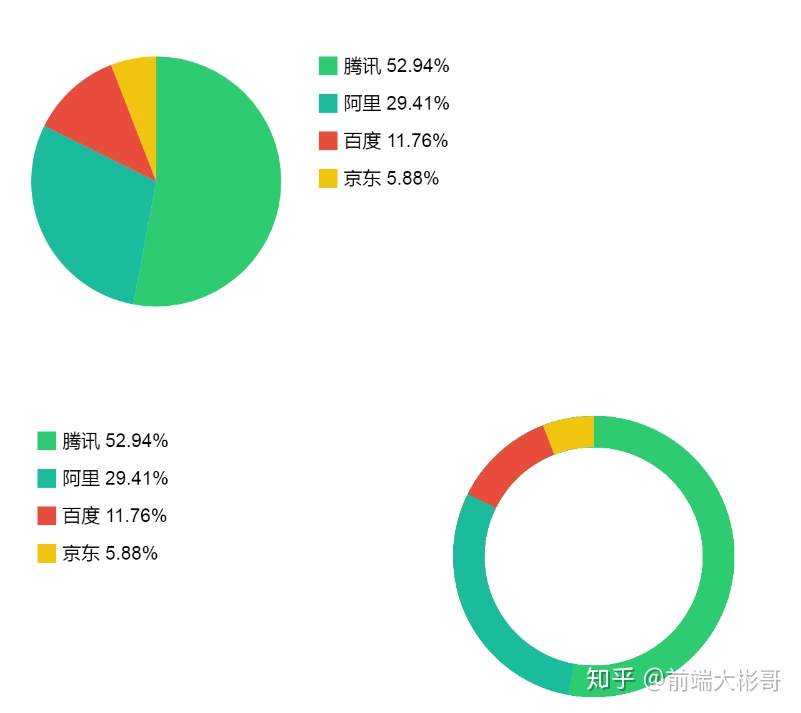
上篇我们用Canvas制作了windows绘图软件。本篇我们将柱状图,扇形图,环形图三类图表使用面向对象的方式写出来。
第三篇我们完成过面向对象的柱状图,便于理解,所以在第三篇对对象的方法,拆分的很细致,显而易见的就是代码的行数增加了,我们在实际开发过程中,只要把核心部分注释出来,能够让自己和同事看懂就行。
这节篇文章中我们专门说下面向对象的图表制作,这个和实际工作场景是一样的。
1.我们先不用考虑怎么写,我们先考虑怎么用。
<!DOCTYPE html>
<html lang="zh">
<head>
<meta charset="UTF-8">
<meta name="viewport" content="width=device-width, initial-scale=1, user-scalable=no">
<title>面向对象图表</title>
<style>
.countdown{
border:2px solid green;
}
</style>
</head>
<body>
<div style="width:600px;height:300px;">
<canvas id="canvas1" width="600px" height="300px"></canvas>
</div>
<div style="width:600px;height:300px;">
<canvas id="canvas2" width="600px" height="300px"></canvas>
</div>
<div style="width:600px;height:300px;">
<canvas id="canvas3" width="600px" height="300px"></canvas>
</div>
<div class="countdownwrap"></div>
<script src="fchart.js"></script>
<script>
var data = {
'阿里': {'figure': 100, 'color': '#1abc9c'},
'腾讯': {'figure': 180, 'color': '#2ecc71'},
'百度': {'figure': 40, 'color': '#e74c3c'},
'京东': {'figure': 20, 'color': '#f1c40f'},
}
var opt1 = {
data: data,
align: 'left',
wrapper: document.getElementById('canvas1'),
r: 200
};
var fcs1 = new fchart(opt1);
var opt2 = {
data: data,
align: 'right',
wrapper: document.getElementById('canvas2'),
r: 200,
type: 'ringchart'
};
var fcs2 = new fchart(opt2);
var opt3 = {
data: data,
wrapper: document.getElementById('canvas3'),
type: 'barchart'
};
var fcs3 = new fchart(opt3);
</script>
</body>
</html>其实很简单的,重点就两部分,数据+图表配置,就是这里
var data = {
'阿里': {'figure': 100, 'color': '#1abc9c'},
'腾讯': {'figure': 180, 'color': '#2ecc71'},
'百度': {'figure': 40, 'color': '#e74c3c'},
'京东': {'figure': 20, 'color': '#f1c40f'},
}
var opt1 = {
data: data,
align: 'left',
wrapper: document.getElementById('canvas1'),
r: 200
};
知道了这些,我们考虑下,fchart.js怎么写。
既然是面向对象方式,而且上面我们也有
var fcs1 = new fchart(opt1);
啥也不用说了,开始先把架子搭出来。
2.正式写库,
首先,肯定得先有一个fchart对象,属性的话,我们怎么用就怎么写。
function fchart(opt) {
this.canvas = opt.wrapper; // canvas
this.ctx = opt.wrapper.getContext('2d'); // canvas context
this.type = opt.type || 'piechart';
this.data = new fdata(opt.data);
this.data.total = utils.getTotal(this.data.raw);
utils.sort(this.data.raw, this.data.sorted);
utils.getPercentage(this.data.sorted, this.data.percentage, this.data.total);
this.getWrapperSize();
this.draw(opt);
}
接着,我们要有一堆各种类型的柱状图,我们不管数据,我先看看怎么样把各种图形new出来。
fchart.prototype.draw = function(opt) {
var obj;
switch(this.type){
case 'ringchart':
obj = new RingChart(opt, this);
break;
case 'barchart':
obj = new BarChart(opt, this);
break;
default:
obj = new PieChart(opt, this);
break;
}
obj.draw();
};
这样大家就看明白了,其实就是通过选择传入不同的type 去new对应图表的对象。我们一个明白了,其它就都明白了,其实都是一个套路。因为我们前面已经说过柱状图,大家理解容易些,我们就深入分析下柱状图。
继续,我们深入了解下barchart
function BarChart(opt, fc) {
    this.ctx = fc.ctx;
    this.canvas = fc.canvas;
    this.data = fc.data;
}
构造函数,没什么好看的,无非就是传入需要的各种数据和画布,重点我们看看方法。
2.画图表上的label文字。
BarChart.prototype._drawAxisYLabel = function(x, y, figure) {
    var ctx = this.ctx;
    ctx.font = "30px -apple-system-font, "Helvetica Neue", Helvetica, STHeiTi, sans-serif";
    var txt = figure;
    ctx.fillStyle = "#000000";
    ctx.fillText(figure, x - ctx.measureText(txt).width - 10, y + 15);
}
这个也很容易,无非就是位置、内容,fillStyle、fillText都是老朋友了。
3.画坐标轴
BarChart.prototype._drawAxis = function(ctx) {
this.centerX = this.canvas.width / 2;
this.centerY = this.canvas.height / 2;
// 80%的画布长宽作为坐标轴
this.axisXLen = this.canvas.width * 0.8;
this.axisYLen = this.canvas.height * 0.8;
this.axisZeroPointX = this.centerX - this.axisXLen / 2;
this.axisZeroPointY = this.centerY + this.axisYLen / 2;
this.axisDesPointX = this.axisZeroPointX + this.axisXLen;
this.axisDesPointY = this.axisZeroPointY - this.axisYLen;
// 画坐标轴
ctx.beginPath();
// 回到原点
ctx.moveTo(this.axisZeroPointX, this.axisZeroPointY);
//
ctx.lineTo(this.axisDesPointX, this.axisZeroPointY);
ctx.moveTo(this.axisZeroPointX, this.axisZeroPointY);
ctx.lineTo(this.axisZeroPointX, this.axisDesPointY);
ctx.lineWidth = 1;
ctx.closePath();
ctx.stroke();
// Y轴数值每节高度
this.axisYPerLen = this.axisYLen / 4;
// 找最大值
var max = 0;
this.arrLen = 0;
for (key in this.data.raw) {
if (this.data.raw[key].figure > max) {
max = this.data.raw[key].figure;
}
this.arrLen++;
}
// Y轴数值
this.yValue = Math.ceil(max / 4);
var bitArr = [];
// 计算端值
this.accu = 0;
for (var i = 5; i > 0 ; i =i + 5) {
this.accu = i * 4;
if (this.accu > this.yValue) {
break;
}
}
// 画Y坐标轴端点及数值
ctx.beginPath();
for (var i = 0; i <= 4; i++) {
var x = this.axisZeroPointX - 5;
var y = this.axisZeroPointY - i * this.axisYPerLen - 5;
this._drawAxisYLabel(x, y, this.accu * i);
ctx.fillRect(x, y, 10, 10);
}
ctx.closePath();
};
我们之前柱状图的时候,已经绘画坐标了,只是改了一种写法,包在对象里,没有什么理由不会,当然了剩下的就是数学的一通算,麻烦,但是不复杂。
4.画柱状图
BarChart.prototype._drawBar = function() {
    var ctx = this.ctx;
    // x轴上放bar的允许长度
    var barAxisW = this.axisXLen * 0.8;
    var barW = barAxisW / this.arrLen * 0.7;
    var gap = barAxisW / this.arrLen * 0.3;
    var x = this.axisZeroPointX - (this.axisYLen - barAxisW) / 2

    for (key in this.data.raw) {
        ctx.beginPath();
        var barH = this.data.raw[key].figure / this.accu * this.axisYPerLen;
        var y = this.axisZeroPointY - barH;
        ctx.fillStyle = this.data.raw[key].color;
        ctx.fillRect(x, y, barW, barH);
        x += (barW + gap);
        ctx.closePath();
    }
};
全是数学计算和基础知识,如果大家觉得吃力,就按照你自己的画法也行,但是至少得保证能够用面向对象的把柱状图画出来。
5.最后要把这个图表最后画出来
BarChart.prototype.draw = function() {
    var ctx = this.ctx;
    this._drawAxis(ctx);
    this._drawBar();
};
大家看到里面,其实就调用了话坐标和画柱子的方法,其实就是3,4定义的那些嘛。

其实核心代码并不复杂。
6.我们深入看下数据和配置
看一看,我们如何把html里面的配置和数据搞到库里面,并处理数据和配置的。
html页面里面,我们看下opt3变量以及其依赖:
var data = {
            '阿里': {'figure': 100, 'color': '#1abc9c'},
            '腾讯': {'figure': 180, 'color': '#2ecc71'},
            '百度': {'figure': 40, 'color': '#e74c3c'},
            '京东': {'figure': 20, 'color': '#f1c40f'},
        }
var opt3 = {
            data: data,
            wrapper: document.getElementById('canvas3'),
            type: 'barchart'
        };
var fcs3 = new fchart(opt3);
第一个是数据不用说了,第二个是画到哪里。第三个是画什么类型的图表。
关键点 new fchart(opts),回到库里我们看看。
function BarChart(opt, fc) {
    this.ctx = fc.ctx;
    this.canvas = fc.canvas;
    this.data = fc.data;
}
继续看,data被哪些方法用了,肯定是画柱状图和坐标。
BarChart.prototype._drawBar = function() {
    var ctx = this.ctx;
    // x轴上放bar的允许长度
    var barAxisW = this.axisXLen * 0.8;
    var barW = barAxisW / this.arrLen * 0.7;
    var gap = barAxisW / this.arrLen * 0.3;
    var x = this.axisZeroPointX - (this.axisYLen - barAxisW) / 2

    for (key in this.data.raw) {
        ctx.beginPath();
        var barH = this.data.raw[key].figure / this.accu * this.axisYPerLen;
        var y = this.axisZeroPointY - barH;
        ctx.fillStyle = this.data.raw[key].color;
        ctx.fillRect(x, y, barW, barH);
        x += (barW + gap);
        ctx.closePath();
    }
};
重点在这:
for (key in this.data.raw) {
        ctx.beginPath();
        var barH = this.data.raw[key].figure / this.accu * this.axisYPerLen;
        var y = this.axisZeroPointY - barH;
        ctx.fillStyle = this.data.raw[key].color;
        ctx.fillRect(x, y, barW, barH);
        x += (barW + gap);
        ctx.closePath();
    }
这里我们就看到了,数据通过for in循环用到了对应的fillRect里面。
到此为止,我们深入的分析了:
1.面向对象图表库怎么使用的。
2.根据用法,我们如何创建构造函数
3.构造函数如何调用画坐标和柱图的方法。
4.柱图方法和画坐标方法实现。
5.html页面数据和配置项如何传到库里面进行使用。
3.总结
其实其他的图跟柱状图画法套路一模一样,无非是调用了对应的画图方法:
整体库最终完整如下fchart.js:
var utils = {
sort: function(raw, sorted) {
var sortTable = [];
for (key in raw) {
sortTable.push([key, raw[key].figure]);
}
sortTable.sort(function(a, b) {return b[1] - a[1]});
// resume other data field value
for (key in sortTable) {
var index = sortTable[key][0];
sorted[index] = {};
for (k in raw[index]) {
sorted[index][k] = raw[index][k];
}
}
},
getTotal: function(raw) {
var total = 0;
for (key in raw) {
total += raw[key].figure;
}
return total;
},
getPercentage: function(sorted, percentage, total) {
for (key in sorted) {
percentage[key] = sorted[key].figure / total;
}
},
getRadius: function(deg) {
return deg / 180 * Math.PI;
},
};
/**
* BarChart
*/
function BarChart(opt, fc) {
this.ctx = fc.ctx;
this.canvas = fc.canvas;
this.data = fc.data;
}
BarChart.prototype.draw = function() {
var ctx = this.ctx;
this._drawAxis(ctx);
this._drawBar();
};
BarChart.prototype._animateDraw = function(drawFunc) {
drawFunc.call(self);
};
BarChart.prototype._drawAxisYLabel = function(x, y, figure) {
var ctx = this.ctx;
ctx.font = "30px -apple-system-font, "Helvetica Neue", Helvetica, STHeiTi, sans-serif";
var txt = figure;
ctx.fillStyle = "#000000";
ctx.fillText(figure, x - ctx.measureText(txt).width - 10, y + 15);
}
BarChart.prototype._drawBar = function() {
var ctx = this.ctx;
// x轴上放bar的允许长度
var barAxisW = this.axisXLen * 0.8;
var barW = barAxisW / this.arrLen * 0.7;
var gap = barAxisW / this.arrLen * 0.3;
var x = this.axisZeroPointX - (this.axisYLen - barAxisW) / 2
for (key in this.data.raw) {
ctx.beginPath();
var barH = this.data.raw[key].figure / this.accu * this.axisYPerLen;
var y = this.axisZeroPointY - barH;
ctx.fillStyle = this.data.raw[key].color;
ctx.fillRect(x, y, barW, barH);
x += (barW + gap);
ctx.closePath();
}
};
BarChart.prototype._drawAxis = function(ctx) {
this.centerX = this.canvas.width / 2;
this.centerY = this.canvas.height / 2;
// 80%的画布长宽作为坐标轴
this.axisXLen = this.canvas.width * 0.8;
this.axisYLen = this.canvas.height * 0.8;
this.axisZeroPointX = this.centerX - this.axisXLen / 2;
this.axisZeroPointY = this.centerY + this.axisYLen / 2;
this.axisDesPointX = this.axisZeroPointX + this.axisXLen;
this.axisDesPointY = this.axisZeroPointY - this.axisYLen;
// 画坐标轴
ctx.beginPath();
// 回到原点
ctx.moveTo(this.axisZeroPointX, this.axisZeroPointY);
//
ctx.lineTo(this.axisDesPointX, this.axisZeroPointY);
ctx.moveTo(this.axisZeroPointX, this.axisZeroPointY);
ctx.lineTo(this.axisZeroPointX, this.axisDesPointY);
ctx.lineWidth = 1;
ctx.closePath();
ctx.stroke();
// Y轴数值每节高度
this.axisYPerLen = this.axisYLen / 4;
// 找最大值
var max = 0;
this.arrLen = 0;
for (key in this.data.raw) {
if (this.data.raw[key].figure > max) {
max = this.data.raw[key].figure;
}
this.arrLen++;
}
// Y轴数值
this.yValue = Math.ceil(max / 4);
var bitArr = [];
// 计算端值
this.accu = 0;
for (var i = 5; i > 0 ; i =i + 5) {
this.accu = i * 4;
if (this.accu > this.yValue) {
break;
}
}
// 画Y坐标轴端点及数值
ctx.beginPath();
for (var i = 0; i <= 4; i++) {
var x = this.axisZeroPointX - 5;
var y = this.axisZeroPointY - i * this.axisYPerLen - 5;
this._drawAxisYLabel(x, y, this.accu * i);
ctx.fillRect(x, y, 10, 10);
}
ctx.closePath();
};
/**
* PieChart
*/
function PieChart(opt, fc) {
this.ctx = fc.ctx;
this.canvas = fc.canvas;
this.data = fc.data;
this.cx = opt.cx || 100; // piechart x coordinate
this.cy = opt.cy || 100; // piechart y coordinate
this.r = opt.r || 100;
this.lineWidth = opt.lineWidth || 50;
this.align = opt.align || 'center';
}
PieChart.prototype.draw = function() {
this._align();
this._animateDraw(this._drawPieChart);
};
PieChart.prototype._animateDraw = function(drawFunc) {
var ctx = this.ctx;
var startDeg = -90;
var incre = 30;
var self = this;
var dr = setInterval(function() {
ctx.save();
ctx.clearRect(0,0,600,600);
drawFunc.call(self, startDeg);
startDeg += incre;
if (startDeg >= 300) {
clearInterval(dr);
PieChart.prototype._drawLabel.call(self);
}
ctx.restore();
}, 30);
};
// draw piechart
PieChart.prototype._drawPieChart = function(startDeg){
var ctx = this.ctx;
// var startDeg = -90; // top degree is -90 degree
var deg = 0; // start degree
var endDeg = 0; // end degree
var startRadius = 0; // start radius
var endRadius = 0; // end radius
var startPos = {'x': this.cx, 'y': this.r - this.y}; // start drawing position
var endPos = {'x': 0, 'y': 0}; // end line position
this.currentDeg = 0; //accumulated degrees for drawing icon
for (key in this.data.percentage) {
this.data.info[key] = {};
deg = this.data.percentage[key] * 360;
if (deg === 0) {
continue;
}
endDeg = startDeg + deg;
startRadius = utils.getRadius(startDeg);
endRadius = utils.getRadius(endDeg);
//store info
this.data.info[key].deg = deg;
this.data.info[key].startDeg = startDeg;
this.data.info[key].endDeg = endDeg;
this.data.info[key].startRadius = startRadius;
this.data.info[key].endRadius = endRadius;
// drawing pichart
ctx.beginPath();
ctx.moveTo(this.cx, this.cy);
ctx.lineTo(startPos.x, startPos.y);
ctx.arc(this.cx, this.cy, this.r, startRadius, endRadius, 0, 0);
this._getPos(endDeg, endPos, this.r);
ctx.fillStyle = this.data.sorted[key].color;
ctx.fill();
ctx.closePath();
// next sector data
startDeg = endDeg;
startPos.x = endPos.x;
startPos.y = endPos.y;
}
};
// get end line of sector position
PieChart.prototype._getPos = function(currentDeg, lineToPos, r) {
var radius = 0;
var deg = 0;
currentDeg += 90;
if (currentDeg > 360) {
currentDeg -= 360;
}
if (currentDeg <= 90) {
deg = 90 - currentDeg;
radius = utils.getRadius(deg);
lineToPos.x = this.cx + Math.cos(radius) * r;
lineToPos.y = this.cy - Math.sin(radius) * r;
}
else if (currentDeg <= 180) {
deg = currentDeg - 90;
radius = utils.getRadius(deg);
lineToPos.x = this.cx + Math.cos(radius) * r;
lineToPos.y = this.cy + Math.sin(radius) * r;
}
else if (currentDeg <= 270) {
deg = 270 - currentDeg;
radius = utils.getRadius(deg);
lineToPos.x = this.cx - Math.cos(radius) * r;
lineToPos.y = this.cy + Math.sin(radius) * r;
}
else if (currentDeg <= 360) {
deg = currentDeg - 270;
radius = utils.getRadius(deg);
lineToPos.x = this.cx - Math.cos(radius) * r;
lineToPos.y = this.cy - Math.sin(radius) * r;
}
};
PieChart.prototype._align = function() {
switch(this.align){
case 'left':
this.cx = this.r + this.lineWidth;
break;
case 'right':
this.cx = this.canvas.clientWidth - this.r - this.lineWidth;
break;
default:
this.cx = this.canvas.clientWidth / 2;
break;
}
this.cy = this.canvas.clientHeight / 2;
};
// draw label and data
PieChart.prototype._drawLabel = function() {
var ctx = this.ctx;
switch(this.align){
case 'left':
var x = this.cx + this.r + 60;
break;
case 'right':
var x = 60;
break;
default:
return;
break;
}
var y = this.cy - this.r;
for (key in this.data.sorted) {
ctx.fillStyle = this.data.sorted[key].color;
ctx.fillRect(x, y, 30, 30);
PieChart.prototype._drawText.call(this, x, y, key);
y += 60;
}
};
PieChart.prototype._drawText = function(x, y, key) {
var ctx = this.ctx;
ctx.font = "30px -apple-system-font, "Helvetica Neue", Helvetica, STHeiTi, sans-serif";
ctx.fillStyle = "#000000";
var showFigure = Math.round(this.data.percentage[key] * 10000) / 100;
ctx.fillText(key + ' ' + showFigure + '%', x + 40, y + 25);
};
/**
* RingChart
*/
function RingChart(opt, fc) {
this.ctx = fc.ctx;
this.canvas = fc.canvas;
this.data = fc.data;
this.cx = opt.cx || 100; // piechart x coordinate
this.cy = opt.cy || 100; // piechart y coordinate
this.r = opt.r || 100;
this.lineWidth = opt.lineWidth || 50; // piechart radius
this.align = opt.align || 'center';
}
RingChart.prototype.draw = function() {
PieChart.prototype._align.call(this);
PieChart.prototype._animateDraw.call(this, this._drawRingChart);
};
RingChart.prototype._drawRingChart = function(startDeg) {
var ctx = this.ctx;
// var startDeg = -90;
var deg = 0;
var endDeg = 0;
var startRadius = 0;
var endRadius = 0;
var startPos = {'x': this.cx, 'y': this.r - this.y}; // start drawing position
var endPos = {'x': 0, 'y': 0}; // end line position
this.currentDeg = 0; //accumulated degrees for drawing icon
for (key in this.data.percentage) {
this.data.info[key] = {};
deg = this.data.percentage[key] * 360;
if (deg === 0) {
continue;
}
endDeg = startDeg + deg;
startRadius = utils.getRadius(startDeg);
endRadius = utils.getRadius(endDeg);
//store info
this.data.info[key].deg = deg;
this.data.info[key].startDeg = startDeg;
this.data.info[key].endDeg = endDeg;
this.data.info[key].startRadius = startRadius;
this.data.info[key].endRadius = endRadius;
// drawing pichart
ctx.beginPath();
ctx.strokeStyle = this.data.sorted[key].color;
ctx.arc(this.cx, this.cy, this.r, startRadius, endRadius, 0);
ctx.lineWidth = this.lineWidth;
ctx.stroke();
ctx.closePath();
// next sector data
startDeg = endDeg;
startPos.x = endPos.x;
startPos.y = endPos.y;
}
};
function fdata(data) {
this.raw = data;
this.sorted = {};
this.info = {};
this.total = 0;
this.percentage = {};
}
function fchart(opt) {
this.canvas = opt.wrapper; // canvas
this.ctx = opt.wrapper.getContext('2d'); // canvas context
this.type = opt.type || 'piechart';
this.data = new fdata(opt.data);
this.data.total = utils.getTotal(this.data.raw);
utils.sort(this.data.raw, this.data.sorted);
utils.getPercentage(this.data.sorted, this.data.percentage, this.data.total);
this.getWrapperSize();
this.draw(opt);
}
// get wrapper size and set canvas size
fchart.prototype.getWrapperSize = function() {
this.canvas.width = this.canvas.parentNode.clientWidth * 2;
this.canvas.height = this.canvas.parentNode.clientHeight * 2;
this.canvas.style.cssText = '-webkit-transform: translateX(-' + (this.canvas.width / 4) + 'px) scale(0.5);-webkit-transform-origin: 50% 0';
};
// draw canvas
fchart.prototype.draw = function(opt) {
var obj;
switch(this.type){
case 'ringchart':
obj = new RingChart(opt, this);
break;
case 'barchart':
obj = new BarChart(opt, this);
break;
default:
obj = new PieChart(opt, this);
break;
}
obj.draw();
};
html部分使用 :
<!DOCTYPE html>
<html lang="zh">
<head>
<meta charset="UTF-8">
<meta name="viewport" content="width=device-width, initial-scale=1, user-scalable=no">
<title>面向对象图表</title>
<style>
.countdown{
border:2px solid green;
}
</style>
</head>
<body>
<div style="width:600px;height:300px;">
<canvas id="canvas1" width="600px" height="300px"></canvas>
</div>
<div style="width:600px;height:300px;">
<canvas id="canvas2" width="600px" height="300px"></canvas>
</div>
<div style="width:600px;height:300px;">
<canvas id="canvas3" width="600px" height="300px"></canvas>
</div>
<div class="countdownwrap"></div>
<script src="fchart.js"></script>
<script>
var data = {
'阿里': {'figure': 100, 'color': '#1abc9c'},
'腾讯': {'figure': 180, 'color': '#2ecc71'},
'百度': {'figure': 40, 'color': '#e74c3c'},
'京东': {'figure': 20, 'color': '#f1c40f'},
}
var opt1 = {
data: data,
align: 'left',
wrapper: document.getElementById('canvas1'),
r: 200
};
var fcs1 = new fchart(opt1);
var opt2 = {
data: data,
align: 'right',
wrapper: document.getElementById('canvas2'),
r: 200,
type: 'ringchart'
};
var fcs2 = new fchart(opt2);
var opt3 = {
data: data,
wrapper: document.getElementById('canvas3'),
type: 'barchart'
};
var fcs3 = new fchart(opt3);
</script>
</body>
</html>
其中一些方法是辅助方法,而另外一些事为了功能完善的,而不是画图的核心方法,大家不用管,比如_animateDraw方法是实现图表动画效果的。
通过本文大家重点学习面向对象画图的组织方式,一旦掌握了,在工作中熟练应用,就能够形成自己的代码风格和和一套自己灵活使用的类库。


 333
333

 被折叠的 条评论
为什么被折叠?
被折叠的 条评论
为什么被折叠?
 到【灌水乐园】发言


