


I would like to change the background colour of the line graph produced by chart.js. There doesn't appear to be an option for this, and the documentation doesn't help. Extensive searching on the interweb has yielded no results. Is this possible?
I must confess I don't really know much about the HTML5 canvas so I'm struggling a bit!
解决方案
With v2.1 of Chart.js, you can write your own plugin to do this
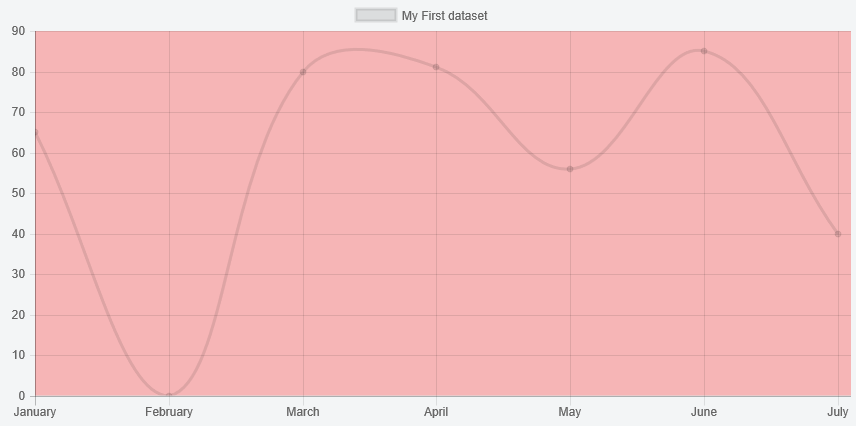
Preview
Script
Chart.pluginService.register({
beforeDraw: function (chart, easing) {
if (chart.config.options.chartArea && chart.config.options.chartArea.backgroundColor) {
var helpers = Chart.helpers;
var ctx = chart.chart.ctx;
var chartArea = chart.chartArea;
ctx.save();
ctx.fillStyle = chart.config.options.chartArea.backgroundColor;
ctx.fillRect(chartArea.left, chartArea.top, chartArea.right - chartArea.left, chartArea.bottom - chartArea.top);
ctx.restore();
}
}
});
and then
...
options: {
chartArea: {
backgroundColor: 'rgba(251, 85, 85, 0.4)'
}
}
...


 389
389


 被折叠的 条评论
为什么被折叠?
被折叠的 条评论
为什么被折叠?
 到【灌水乐园】发言


