


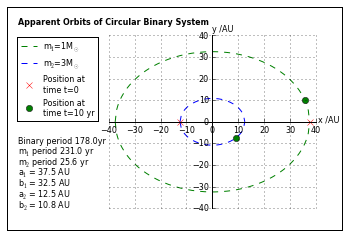
我使用matplotlib获得了以下Python图:
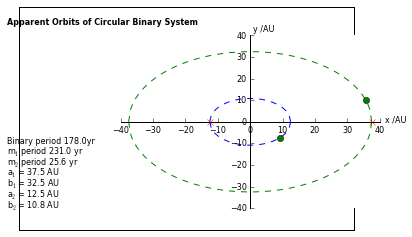
但我需要将其保存为pdf。当我这样做时,它不能正确渲染,许多元素都在错误的位置,有些甚至不会出现。我搜索了但没有找到如何解决这个在我的情况:
这是我的剧情代码:
plt.plot(0, 0)
plt.tick_params(
axis='both',
which='both',
bottom='off',
top='off',
left='off',
right='off',
labelleft='off',
labelbottom='off',
labelsize=8)
a = plt.axes([.36, .2, .6, .6])
plt.tick_params(
axis='both',
which='both',
labelsize=8)
a.spines['left'].set_position('center')
a.spines['bottom'].set_position('center')
a.spines['right'].set_color('none')
a.spines['top'].set_color('none')
a.xaxis.set_ticks_position('bottom')
a.yaxis.set_ticks_position('left')
plt.plot(x,y1, 'g--',label='m$_{1}$=' +str(mass1)+'M$_{\odot}$')
plt.plot(x,y2, 'b--',label='m$_{2}$=' +str(mass2)+'M$_{\odot}$')
plt.plot(x,y1n, 'g--')
plt.plot(x,y2n, 'b--')
plt.plot(start1[0],start1[1], 'xr',label='Position at \ntime t=0')
plt.plot(start2[0],start2[1], 'xr')
plt.plot(stop1[0],stop1[1], 'og', label='Position at \ntime t=' + str(t) + ' yr')
plt.plot(stop2[0],stop2[1], 'og')
plt.text(-75,-10, r'Binary period ' + str(period(m1+m2,a1+a2)) + 'yr',fontsize=8)
plt.text(-75,-15, r'm$_{1}$ period ' + str(period(m1,a1)) + ' yr',fontsize=8)
plt.text(-75,-20, r'm$_{2}$ period ' + str(period(m2,a2)) + ' yr',fontsize=8)
plt.text(-75,-25, r'a$_{1}$ = ' + str(a1) + ' AU', fontsize=8)
plt.text(-75,-30, r'b$_{1}$ = ' + str(sigfigs(LOSorbit(0,a1))) + ' AU',fontsize=8)
plt.text(-75,45, 'Apparent Orbits of Circular Binary System', fontsize=8, fontweight='bold')
plt.text(-75,-35, r'a$_{2}$ = ' + str(a2) + ' AU', fontsize=8)
plt.text(-75,-40, r'b$_{2}$ = ' + str(sigfigs(LOSorbit(0,a2))) + ' AU',fontsize=8)
plt.xlabel('x /AU', fontsize=8)
h = plt.ylabel('y /AU', fontsize=8)
h.set_rotation(0)
a.xaxis.set_label_coords(1.06, 0.54)
a.yaxis.set_label_coords(0.55, 1.01)
plt.savefig('binary_sys.pdf', bbox_inches='tight')
plt.grid()
box = a.get_position()
a.set_position([box.x0, box.y0, box.width * 0.8, box.height])
a.legend(numpoints=1,loc='center left',bbox_to_anchor=(-0.46, 0.75),prop={'size':8})
plt.show()如何正确保存文件?


 1275
1275


 被折叠的 条评论
为什么被折叠?
被折叠的 条评论
为什么被折叠?
 到【灌水乐园】发言


