


本文试图回答这样一个问题:
在现有的工具基础上我们是否可以采用 Go 对科学数据进行处理,并且直接得到满足出版要求的图片?
Go 绘图库整理
为了回答这个问题,首先我们有必要对现有的Go绘图库进行简单的整理,具体如下:
- Gonum/plot: 比较成熟的Go绘图库
- Glot: 建立在gnuplot绘图软件基础之上的Go绘图库
- go-chart: 支持时域图
- Gonum/plt: 本文主要介绍的绘图库,其适用方法与matplotlib类似。
为了满足出版要求,一个成熟的绘图库应该满足以下几个基本要求:
- 能够实现点线图
- 能够导出不同格式的文件
- 能够方便的对相关参数进行修改
- 能够兼容latex语法以插入数学符号
待处理数据
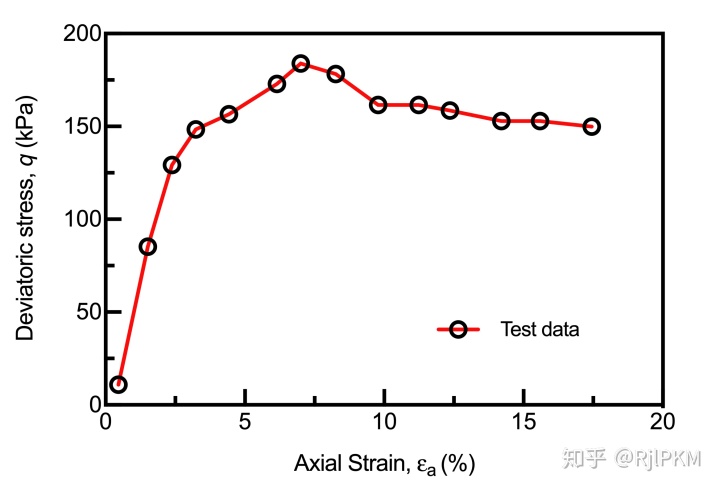
示例数据如下:
x, y
0.4626, 10.98
1.5198, 85.26
2.3789, 129.26
3.2379, 148.46
4.4273, 156.62
6.1454, 172.99
7.0044, 183.93
8.2599, 178.3
9.7797, 161.64
11.2335, 161.5
12.3568, 158.64
14.207, 152.97
15.5947, 152.84
17.4449, 149.91
Prism绘图
Prism是一款适用于mac操作系统的商业数据处理软件,我们首先采用Prism对上述数据进行处理,生成数据图基本满足出版要求。
matplotlib绘图
matplotlib是成熟的python可视化库,能够方便的制作美观与高可读性的图表。
ax设置: 我们通过修改默认设定来改善出图效果。
import matplotlib as mpl
import matplotlib.pyplot as plt
import matplotlib.ticker as ticker
import matplotlib.gridspec as gridspec


#plt.xkcd()
font = {
    'family': 'serif',
        'color':  'black',
        'weight': 'normal',
        'size': 14}


def setAx(ax):
    plt.tick_params(labelsize=12)
    ax.xaxis.set_major_locator(ticker.AutoLocator())
    ax.xaxis.set_minor_locator(ticker.AutoMinorLocator())
    ax.yaxis.set_major_locator(ticker.AutoLocator())
    ax.yaxis.set_minor_locator(ticker.AutoMinorLocator())
    ax.tick_params(axis='both', which='major',
                    direction='in', length=6, width=1.5, colors='k')
    ax.tick_params(axis='both', which='minor',
                   direction=
最低0.47元/天 解锁文章


 5982
5982


 被折叠的 条评论
为什么被折叠?
被折叠的 条评论
为什么被折叠?
 到【灌水乐园】发言


