1 说明:
=====
1.1 我曾介绍过:《PyVista是一款python的可视化工具包(VTK)的高级API》,是很受喜欢的。
1.2 PyVista是VTK的python高级API,国内基本没有介绍和教程。
1.3 PyVista比VTK、pyqt5和pyside2都简单,所以,有必要再次深入介绍。

2 生成gif并播放:
============
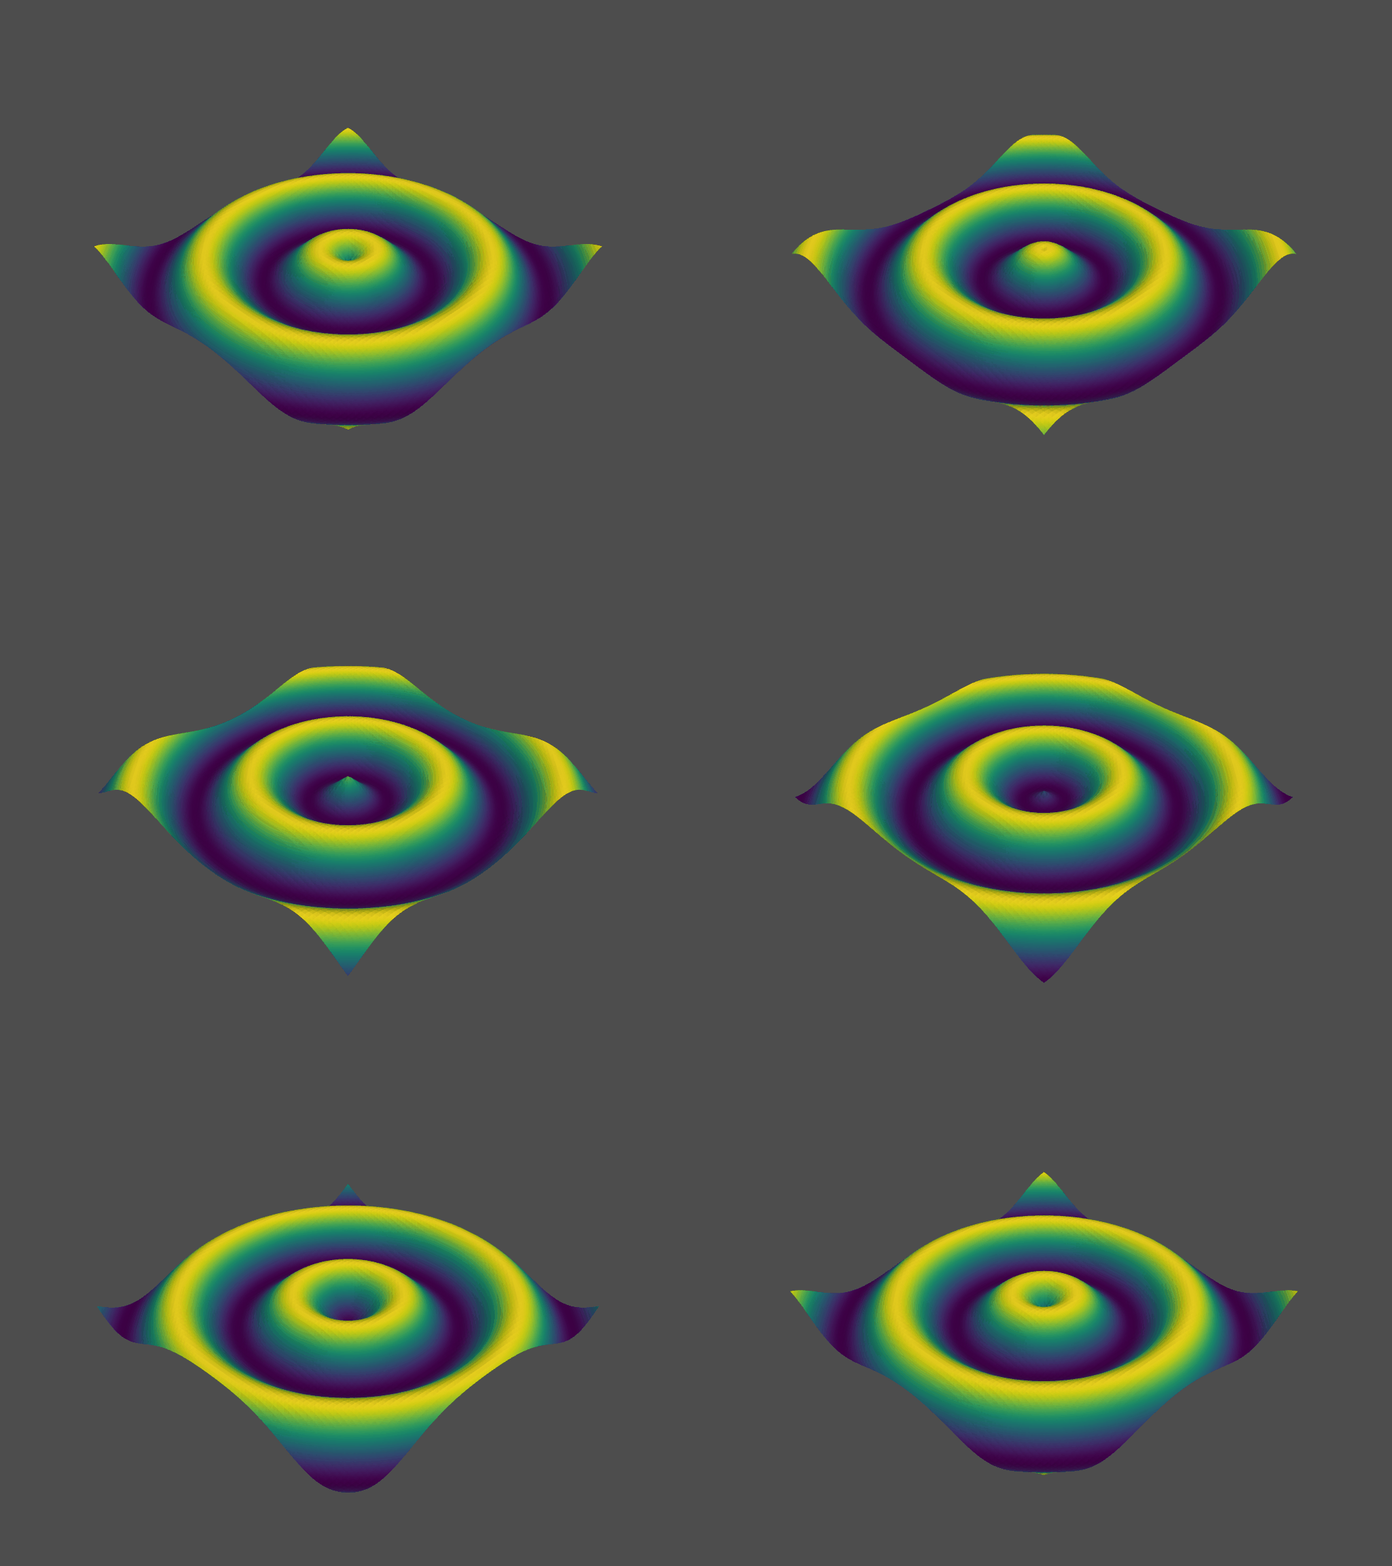
2.1 效果图:

2.2 代码:
#第1步:导入模块import pyvista as pvimport numpy as np#第2步:3维坐标点取值范围x = np.arange(-10, 10, 0.25)y = np.arange(-10, 10, 0.25)#meshgrid的作用适用于生成网格型数据#可以接受两个一维数组生成两个二维矩阵,对应两个数组中所有的(x,y)对x, y = np.meshgrid(x, y)#np.sqrt(x) : 计算数组各元素的平方根r = np.sqrt(x ** 2 + y ** 2)#获取z值z = np.sin(r)# Create and structured surfacegrid = pv.StructuredGrid(x, y, z)#第3步:产生plt图:静态图和gif动态图# Create a plotter object and set the scalars to the Z heightplt = pv.Plotter()#加入上面产生的gridplt.add_mesh(grid, scalars=z.ravel())#先按q退出静态图,进入动态图gif展示print('Orient the view, then press "q" to close window and produce movie')# setup camera and closeplt.show(auto_close=False) #参数不能少#第4步:动态播放gif设置# Open a gif,这个文件在根目录下plt.open_gif("wave.gif")#获取点的参数pts = grid.points.copy()# Update Z and write a frame for each updated positionnframe = 30 #数值越大,动态展示时间越久#[:nframe]是列表取值从0取到nframe个for i in np.linspace(0, 2 * np.pi, nframe + 1)[:nframe]: #z值改变 z = np.sin(r + i) pts[:, -1] = z.ravel() #根系 plt.update_coordinates(pts) plt.update_scalars(z.ravel()) plt.write_frame()# Close movie and delete objectplt.close()3 球、线和图例:
============
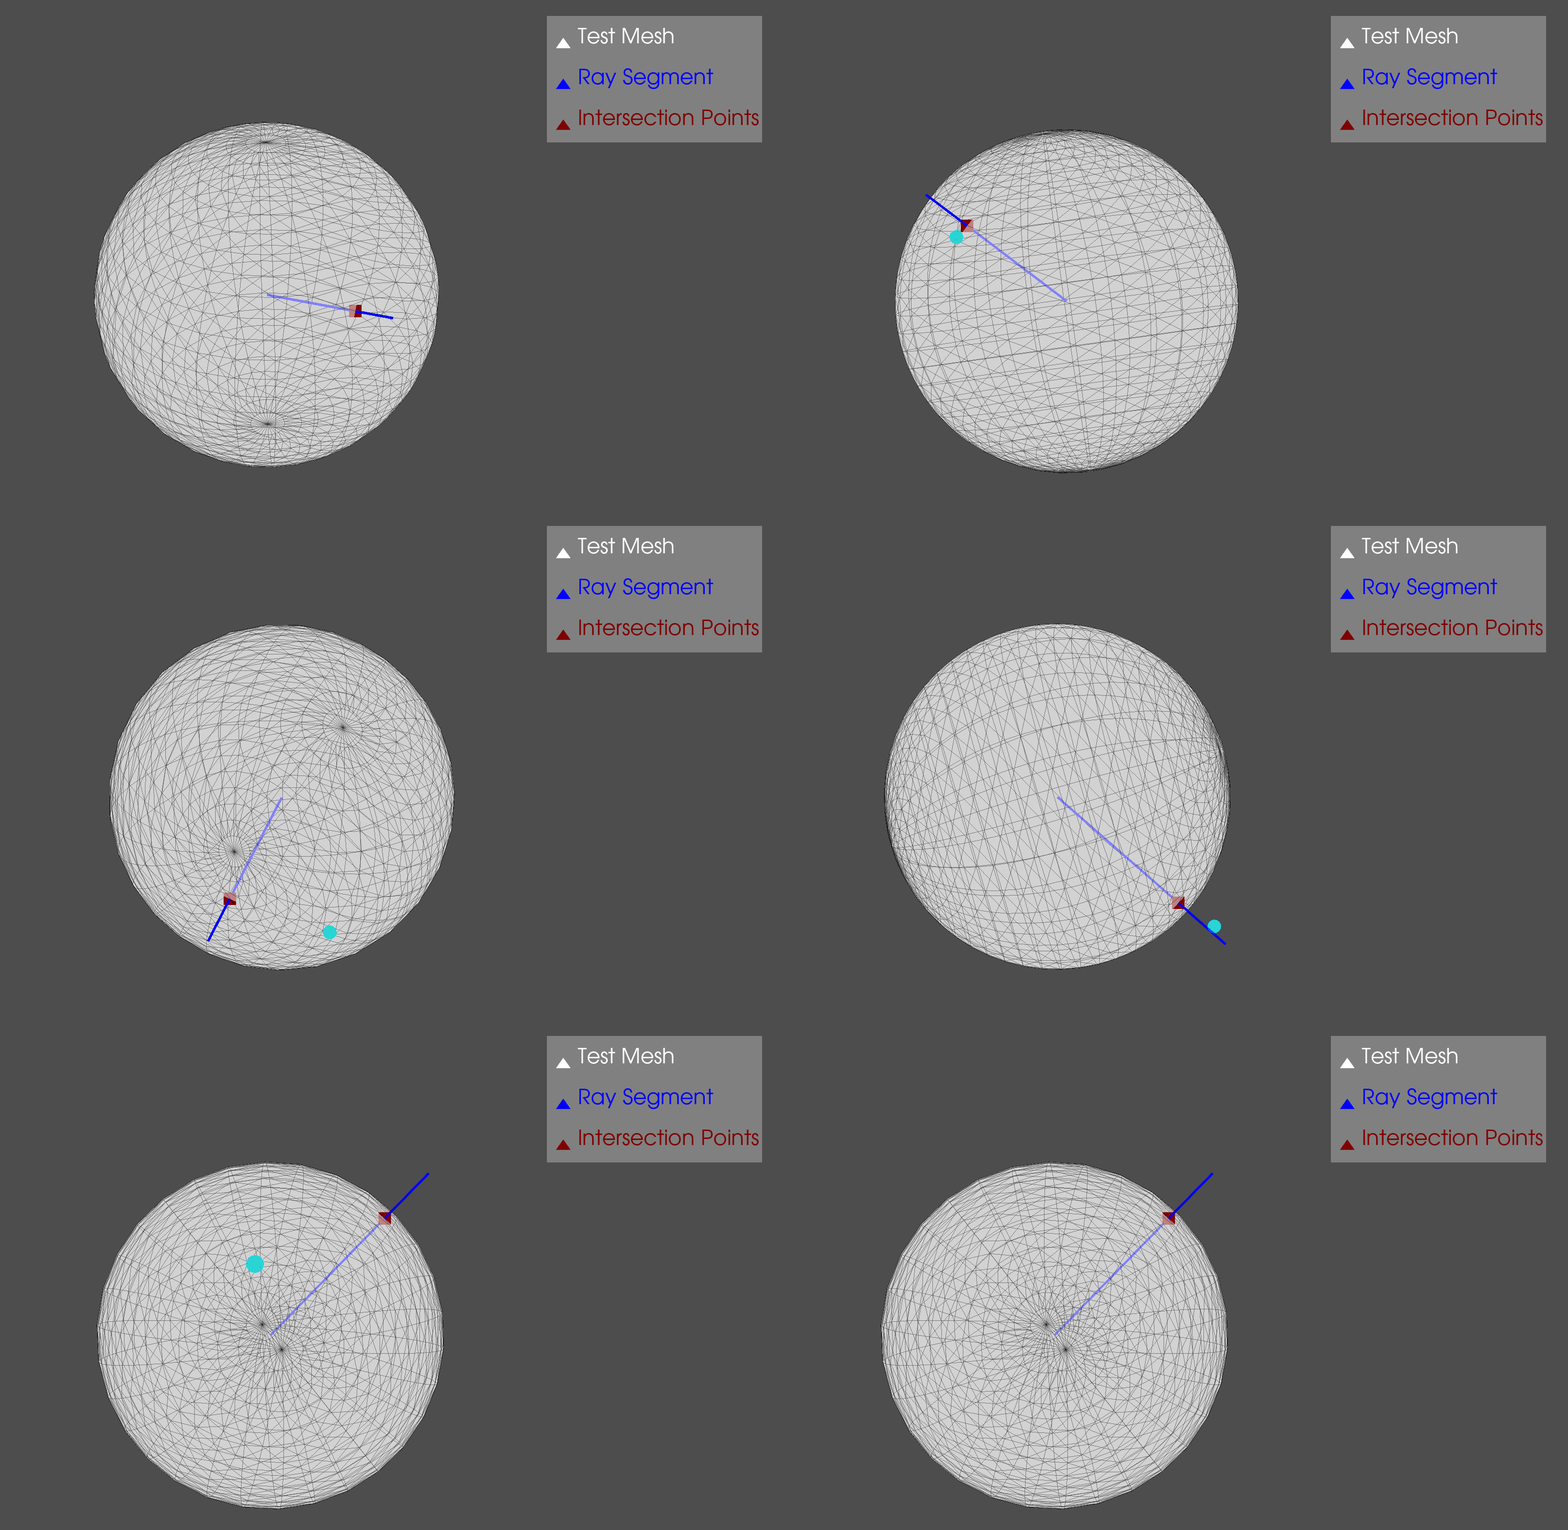
3.1 效果图:

3.2 代码:
import pyvista as pv# Create source to ray tracesphere = pv.Sphere(radius=0.85)# Define line segmentstart = [0, 0, 0]stop = [0.25, 1, 0.5]# Perform ray tracepoints, ind = sphere.ray_trace(start, stop)# Create geometry to represent ray traceray = pv.Line(start, stop)intersection = pv.PolyData(points)# Render the result,调用图p = pv.Plotter()#添加元素mesh,颜色设定、大小和文字标签(图例展示)#添加球==spherep.add_mesh(sphere, show_edges=True, opacity=0.5, color="w", lighting=False, label="Test Mesh")#添加线==rayp.add_mesh(ray, color="blue", line_width=5, label="Ray Segment")p.add_mesh(intersection, color="maroon", point_size=25, label="Intersection Points")#图例展示p.add_legend()#图片展示p.show()4 布局subplot:
===========
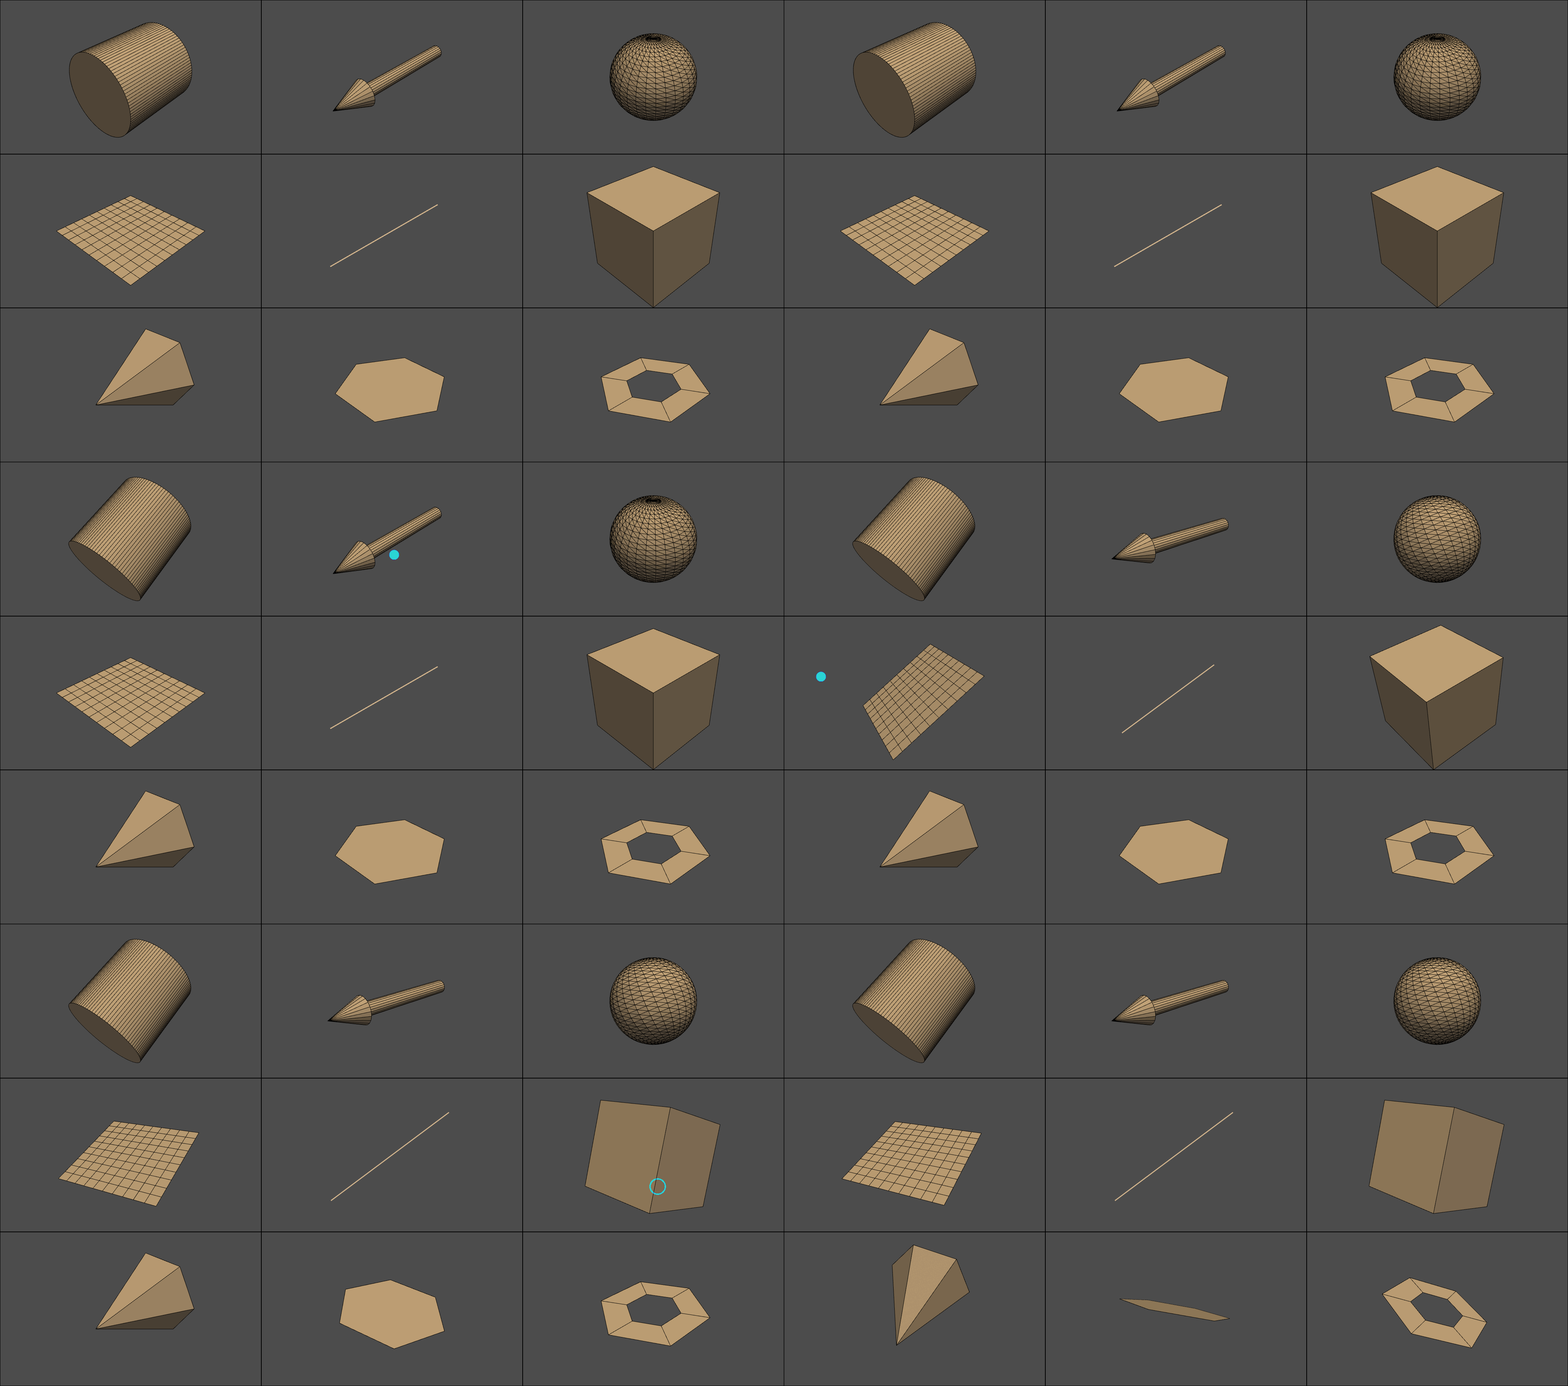
4.1 效果图:

4.2 重点:
#第3步:定义一个图,展示图,布局shape=3*3#就是3行3列p = pv.Plotter(shape=(3, 3))4.3 完整代码:
#第1步:导入模块import pyvista as pv#第2步:实例化模型,调用模型cyl = pv.Cylinder()arrow = pv.Arrow()sphere = pv.Sphere()plane = pv.Plane()line = pv.Line()box = pv.Box()cone = pv.Cone()poly = pv.Polygon()disc = pv.Disc()#第3步:定义一个图,展示图,布局shape=3*3#就是3行3列p = pv.Plotter(shape=(3, 3))# Top row==第1行p.subplot(0, 0)p.add_mesh(cyl, color="tan", show_edges=True)p.subplot(0, 1)p.add_mesh(arrow, color="tan", show_edges=True)p.subplot(0, 2)p.add_mesh(sphere, color="tan", show_edges=True)# Middle row==第2行p.subplot(1, 0)p.add_mesh(plane, color="tan", show_edges=True)p.subplot(1, 1)p.add_mesh(line, color="tan", line_width=3)p.subplot(1, 2)p.add_mesh(box, color="tan", show_edges=True)# Bottom row==第3行p.subplot(2, 0)p.add_mesh(cone, color="tan", show_edges=True)p.subplot(2, 1)p.add_mesh(poly, color="tan", show_edges=True)p.subplot(2, 2)p.add_mesh(disc, color="tan", show_edges=True)# Render all of themp.show()


 本文详细介绍了Python3D可视化库PyVista,该库作为VTK的高级API,因其简洁易用而备受青睐。内容包括如何生成动态GIF、创建球体、线条及图例,并展示了 subplot 布局的使用方法,旨在提供深入的学习指导。


 被折叠的 条评论
为什么被折叠?


