


How Memory works in Java
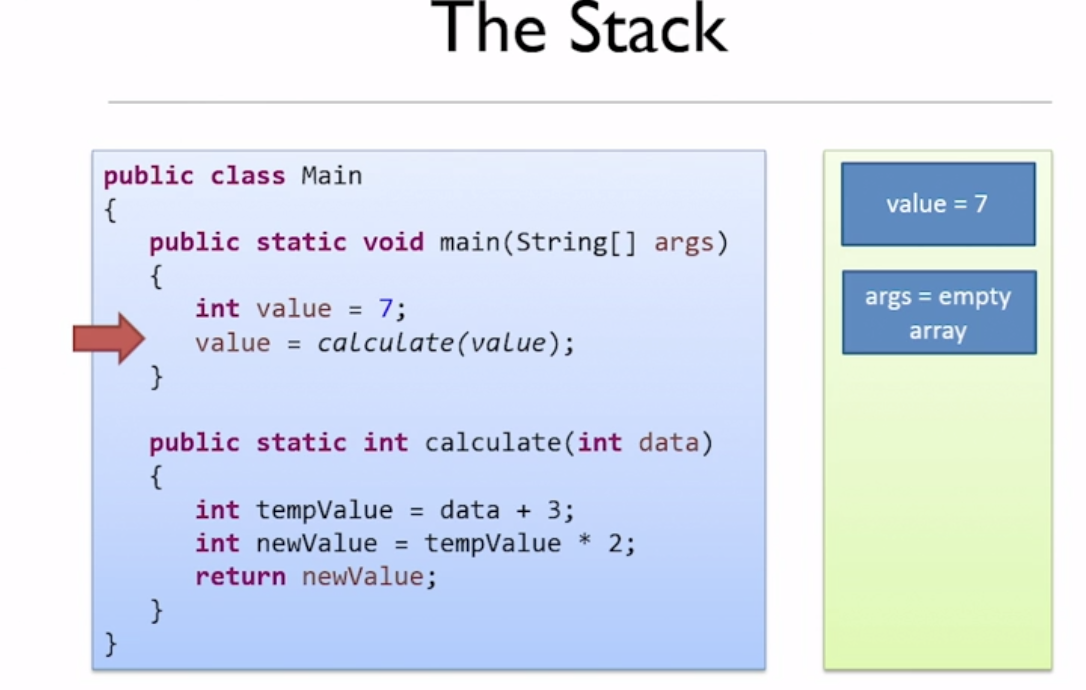
The role of the stack
- Each time you call a function, Java pushed the local variables for that function into the stack.
- When the method returns, all the data created on the stack for the method is popped or pulled from the stack.
- Whenever you reach a closing curly bracket, any local variables you declared inside the block that you're leaving is popped off the stack.
- Each thread has its own stack, so data on the stack can only be seen by the thread that owns the stack.
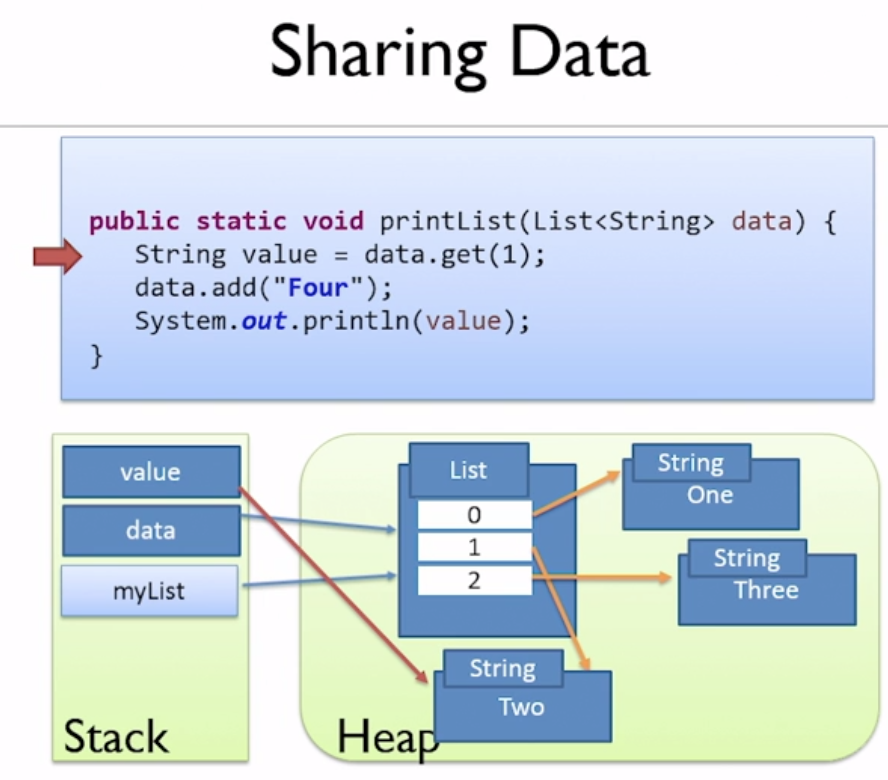
The role of the Heap
- All objects are stored on Heap, and shared across all threads.
- For the objects stored on the Heat there will be a pointer to the objects which is the variable reference stored on the stack.
Introduction to Garbage Collection
- String Pools
- Garbage Eligibility
Any objects on the Heap which cannot be reached through reference from the stack is eligible for GC.
- The gc() and finalize() methods
The gc() method suggests the JVM run GC process, but not guarantee that the JVM will do.
The finalize() method for the java.lang.object, this method is actually called by the gc. The gc might not run, so cannot rely on the finalize method being called.
Generational Garbage Collection
Mark and Sweep
- The general algorithm that GC use is called mark and sweep. It's a two stage process, the first stage is marking, and the second stage is sweeping.
- In the marking stage, the program's execution is first paused (stop the world event). It simply looks every variable in the stack and follows its reference, the object that it finds at the end of the reference is marked as being alive.
- In the sweeping stage, a full scan of the Heap take place, the memory occupied by the objects not marked of in use, can then be freed up. And finally, the objects are being kept are moved to a single continuous block of memory.
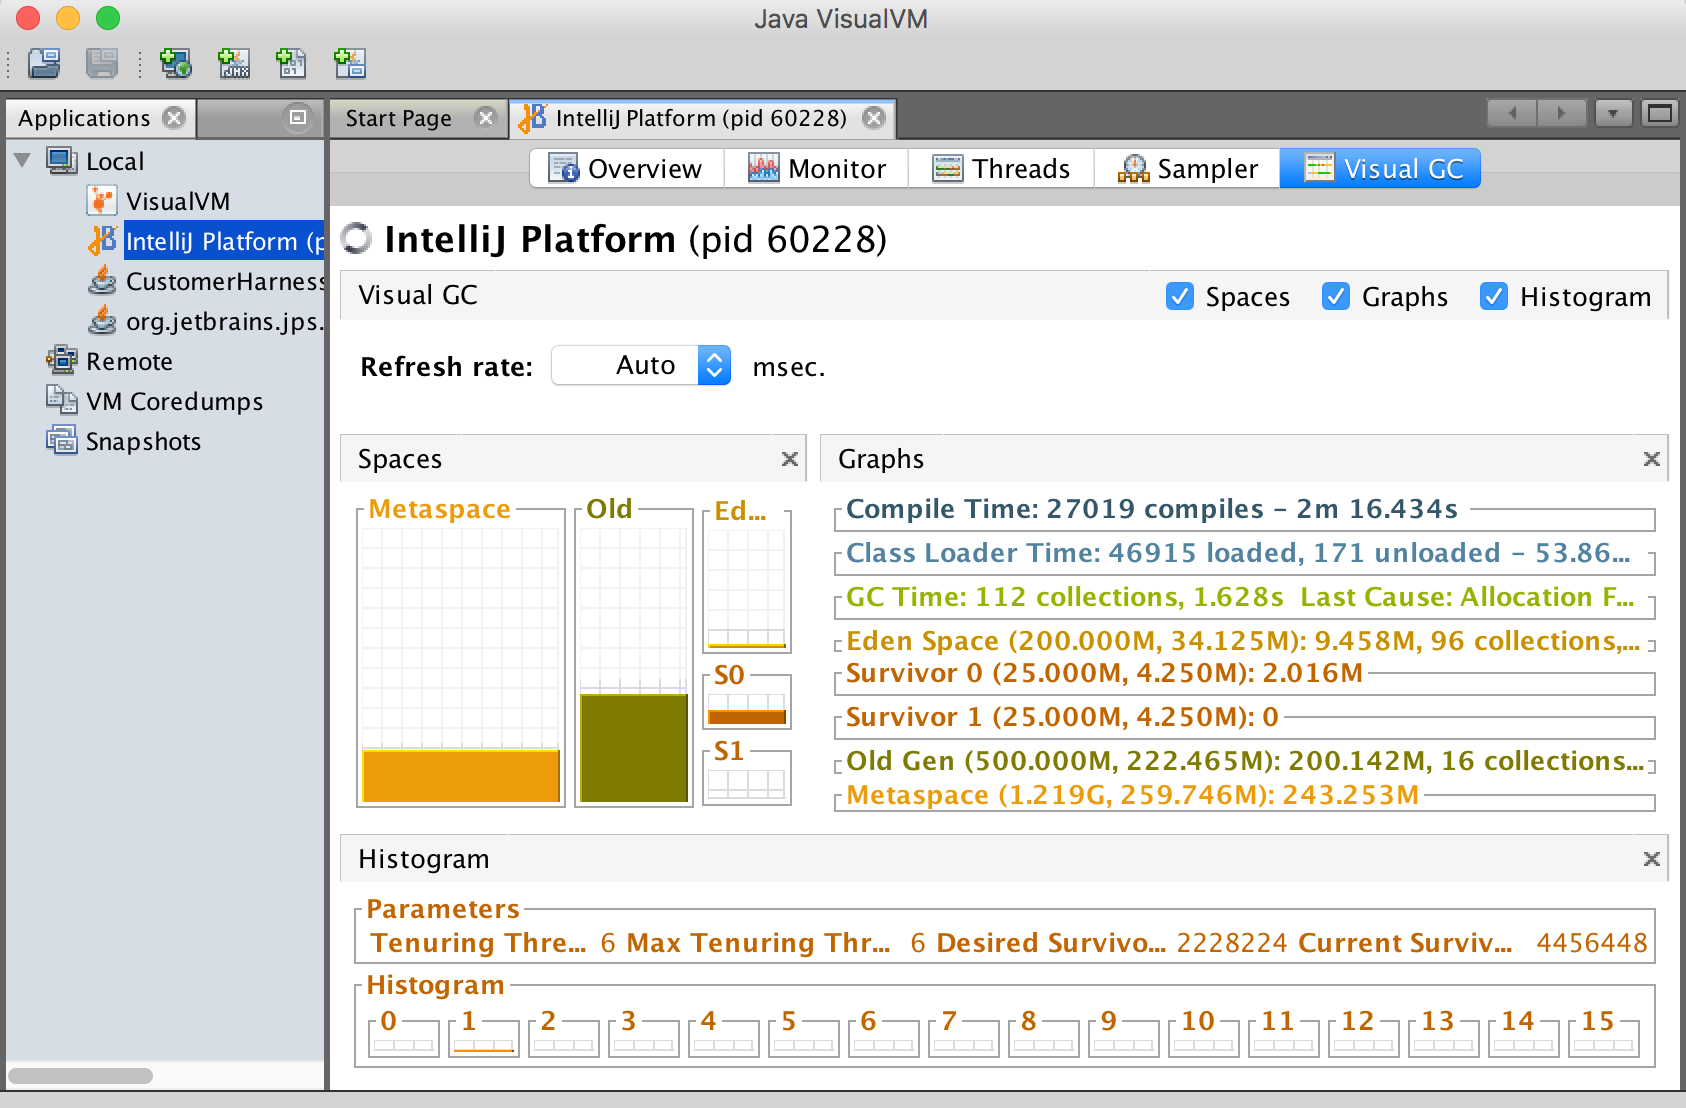
Using the Visual GC tool to view a soft leak
- Young generation (monor GC) VS. old generation (major GC)
- Can view these generations by the visual VM tool
a. $cd $JAVA_HOME/bin
b. $open jvisualvm
c. Need to install a plugin, go to the tools menu -> plugins -> available plugin tab -> select visual GC -> install. After finish install, close and reopen to see the new tab "Visual GC" should appear.
d. Go to the Monitor tab -> Heap Dump, will create Heap dump file for further analyzing.
Using the Memory Analyzer tool
a. Download MAT from eclipse.org/mat
b. Open the Heap dump file by MAT.
** Hit below error when start MAT on MAC:
See the log file
/Users/$USER/.eclipse/227783881_macosx_cocoa_x86_64/configuration/1554282657960.log
!ENTRY org.eclipse.osgi 4 0 2019-04-03 17:11:18.252
10 !MESSAGE Application error
11 !STACK 1
12 java.lang.IllegalStateException: The platform metadata area could not be written: /privat e/var/folders/cp/bnmgrhws25b_3272ly4zn0d00000gn/T/AppTranslocation/94A1F89C-EF58-45B4-A82 5-3D7DCEF5963D/d/mat.app/Contents/MacOS/workspace/.metadata. By default the platform wri tes its content
13 under the current working directory when the platform is launched. Use the -data parameter to
14 specify a different content area for the platform.
Solution:
$ vi mat.app/Contents/Eclipse/MemoryAnalyzer.ini
edit your MemoryAnalyzer.ini file, and add those lines (on two separate lines, and before the vm arguments), replacing the second with the path where you want the MemoryAnalyzer to write its content:
-data
PermGen and the Metaspace
- In the Java 6, there is a further part of the Heap called PermGen. PermGen is nerver garbage-collected. There are two types of objects that go to PermGen, internized strings, and metadata for class.
- From Java 7, internized strings are no longer stored in PermGen, this change means that the internized strings are in the old part of the Heap, and can be garbage-collected.
- From Java 8, they removed the PermGen altogether, instead created something else called MetaSpace, which is where the class metadata are placed.
- The MetaSpace is a separate area of memory and it's not part of the Heap. Instead it's allocated out the host's native memory so the maximum available space for the MetaSpace is the total available system memory for the computer.
Tuning the Virtual Machine
Heap size
-Xmx, -Xms are non-standard argumants, so they are not guaranteed to be implemented on every runtime.
Please reference below page for the Java command line options.
https://docs.oracle.com/javase/8/docs/technotes/tools/windows/java.html
Garbage collection and generation sizes
-verbose:gc
-Xmn : set the size of the young generation
Choosing a garbage collector
- Serial : a single thread
- Parallel : multiple threads running.
- Mostly Concurrent: the stop-the-world part of the GC process is mimimized.


 1110
1110


 被折叠的 条评论
为什么被折叠?
被折叠的 条评论
为什么被折叠?
 到【灌水乐园】发言


