


PNAS:地球地壳的硅含量至少从太古宙早期开始一直保持恒定

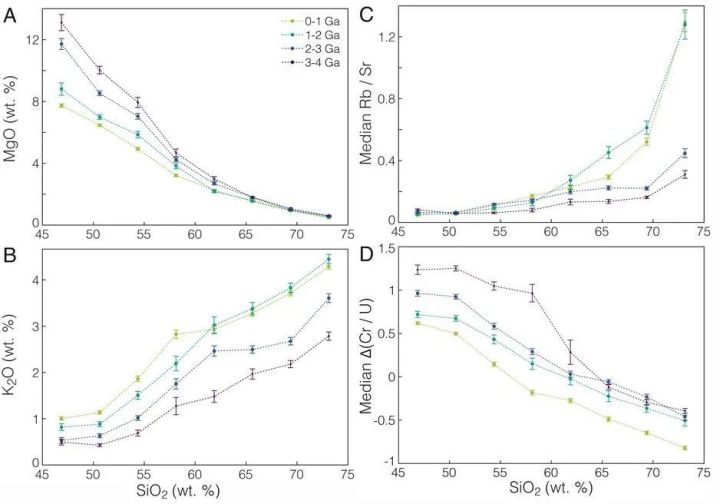
图1 地质历史上岩石MgO、K2O、Rb/Sr和Cr/U等与SiO2在0至4 Ga的四个时间区间内的变化关系图解。其中MgO和K2O为平均值,Rb/Sr和Cr/U比值为中间值,数据选择为95%置信区间,相关的数据库和加权自举证方法的介绍见原文(Keller and Harrison, 2020)
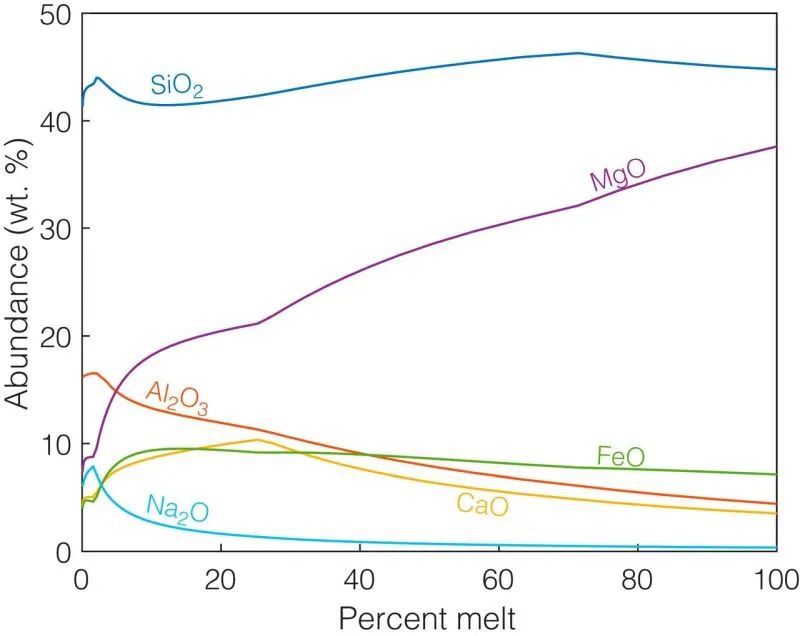
图2 模拟获得的地幔不同程度部分熔融条件下,熔体成分的变化。初始成分为地幔岩以及2Gpa和0.15wt.%含水量(Keller and Harrison, 2020)
为了进一步说明地幔持续降温的影响,作者基于虚拟假设提出了一个硅恒定参考模型,并通过模拟计算获得的一系列主量和微量元素随时间的变化关系(图3)。结果显示,在硅恒定条件下,作为地幔持续降温的直接结果,随着时间的推移,不相容元素含量升高、相容元素含量降低,与实际观察结果高度吻合,再次印证了硅恒定模型的普适性。而后,他们将基于无效假设的模拟结果与前人用其它方法获得的结果进行了进一步的对比(图4A)。发现虽然前人给出的具体数值仅有实际观察值的四分之一(Dhuime et al., 2015),但两种不同方法获得的Rb/Sr比值随时代的演化趋势几乎在误差范围内一致(图4A)。因此,作者认为这一现象仅能用恒定硅条件下Rb/Sr比值的变化来解释。同样地(图4B),硅恒定参考模型给出的MgO的估计值与某些研究的估算结果类似(Greber et al., 2017),但是与其它研究结果的估计值相差很大(Tang et al., 2016)。
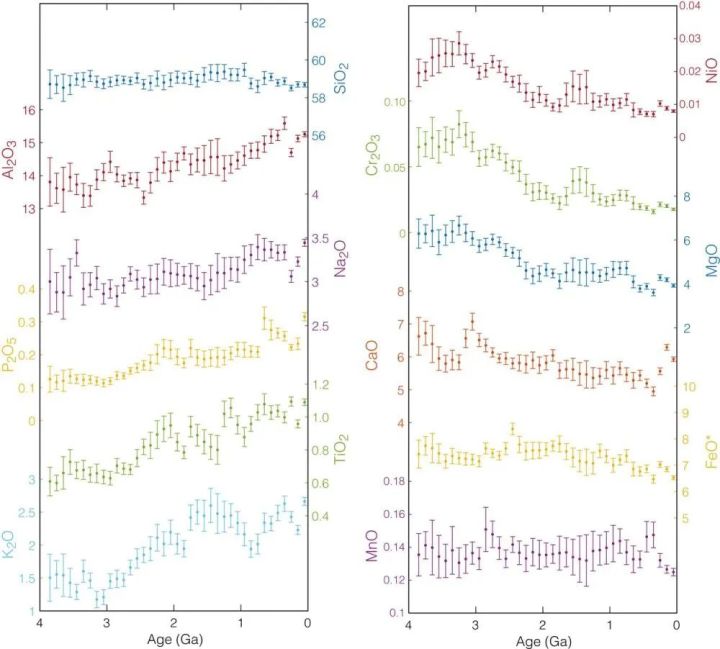
图3 为了进一步说明在地质历史上不同成分岩浆的比例一直保持恒定,Keller and Harrison (2020)基于硅恒定这一无效假设构建的岩浆岩地球化学成分随时间的变化关系图解
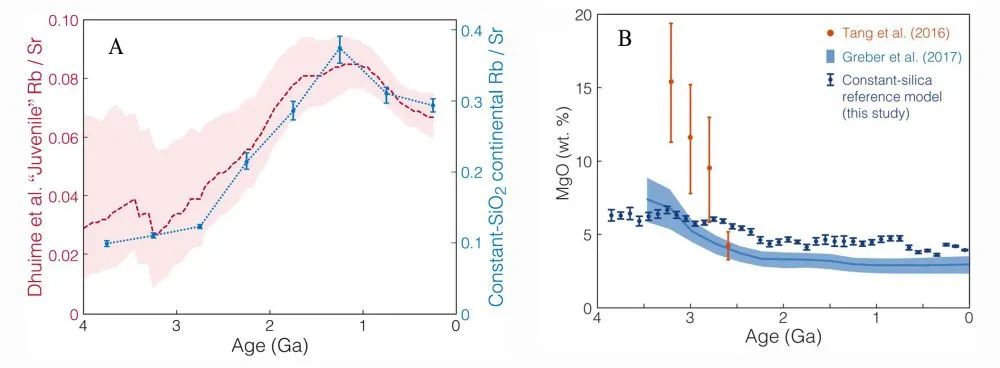
图4 (A)Dhuime et al. (2015)估算的地壳岩石初始Rb/Sr比值(左侧)与Keller and Harrison(2020)基于硅恒定参考模型获得的比值(右侧)的对比。从图中可以看出,虽然Dhuime et al. (2015)给出的值仅有Keller and Harrison (2020)估算的平均地壳值的四分之一,二者的变化趋势是一致的。(B)基于硅恒定模型给出的地壳MgO含量变化趋势,图中也展示了Tang et al. (2016)和Greber et al.(2017)的结果
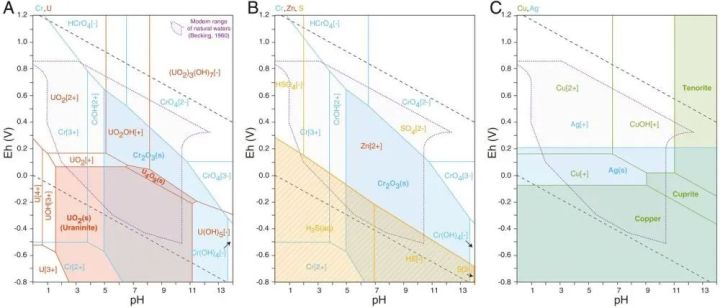
图5 一些元素对在酸碱度和氧化还原区间的矿物相和溶解度的变化。难溶的相在图中用粗体字以及阴影区域表示。这些展示的矿物对,很容易由于一种元素可溶,而另外一种元素不溶,造成明显的熔体分馏效应(Keller and Harrison, 2020)
【致谢:感谢岩石圈室周艳艳副研究员的宝贵修改建议。】

主要参考文献
Keller C B, Harrison T M. Constrainingcrustal silica on ancient Earth[J]. Proceedings of the National Academy ofSciences of the United States of America, 2020, 117: 21101-21107.
Keller B, Schoene B. Plate tectonics and continental basaltic geochemistrythroughout Earth history[J]. Earth and Planetary Science Letters, 2018, 481:290-304.
Keller C B, Schoene B. Statistical geochemistry reveals disruptionin secular lithospheric evolution about 2.5 Gyr ago[J]. Nature, 2012,485(7399): 490-493.
Tang M, Chen K, Rudnick R L. Archean upper crust transition frommafic to felsic marks the onset of plate tectonics[J]. Science, 2016,351(6271): 372-375.
Dhuime B, Wuestefeld A, Hawkesworth C J. Emergence of moderncontinental crust about 3 billion years ago[J]. Nature Geoscience, 2015, 8(7):552-555.
Greber N D, Dauphas N, Bekker A, et al. Titanium isotopic evidencefor felsic crust and plate tectonics 3.5 billion years ago[J]. Science, 2017,357(6357): 1271-1274.
Chen K, Rudnick R L, Wang Z, et al. How mafic was the Archean uppercontinental crust? Insights from Cu and Ag in ancient glacial diamictites[J].Geochimica et Cosmochimica Acta, 2020, 278: 16-29.
Smit M A, Mezger K. Earth’s early O 2 cyclesuppressed by primitive continents[J]. Nature Geoscience, 2017, 10(10):788-792.
KellerC B, Schoene B, Barboni M, et al. Volcanic–plutonic parity and the differentiation of thecontinental crust[J]. Nature, 2015, 523(7560): 301-307.
(撰稿:赵磊/岩石圈室)
校对:覃华清


 1万+
1万+


 被折叠的 条评论
为什么被折叠?
被折叠的 条评论
为什么被折叠?
 到【灌水乐园】发言


