


spring-boot-actuator模块提供了一个监控和管理生产环境的模块,可以使用http、jmx、ssh、telnet等拉管理和监控应用。审计(Auditing)、
健康(health)、数据采集(metrics gathering)会自动加入到应用里面。
首先,写一个最基本的spring boot项目。
基于Maven的项目添加‘starter’依赖:
<dependency>
    <groupId>org.springframework.boot</groupId>
    <artifactId>spring-boot-starter-actuator</artifactId>
</dependency>
以下是所有监控描述:
| HTTP方法 | 路径 | 描述 | 鉴权 |
| GET | /autoconfig | 查看自动配置的使用情况, 该报告展示所有auto-configuration候选者及它们被应用或未被应用的原因 | true |
| GET | /configprops | 显示一个所有@ConfigurationProperties的整理列表 | true |
| GET | /beans | 显示一个应用中所有Spring Beans的完整列表 | true |
| GET | /dump | 打印线程栈 | true |
| GET | /env | 查看所有环境变量 | true |
| GET | /env/{name} | 查看具体变量值 | true |
| GET | /health | 查看应用健康指标 | false |
| GET | /info | 查看应用信息 | false |
| GET | /mappings | 查看所有url映射 | true |
| GET | /metrics | 查看应用基本指标 | true |
| GET | /metrics/{name} | 查看具体指标 | true |
| POST | /shutdown | 允许应用以优雅的方式关闭(默认情况下不启用) | true |
| GET | /trace | 查看基本追踪信息 | true |
比如:http://localhost:8080/health
你可以得到应用健康指标结果
{
status: "UP",
diskSpace: {
status: "UP",
total: 107374174208,
free: 14877962240,
threshold: 10485760
}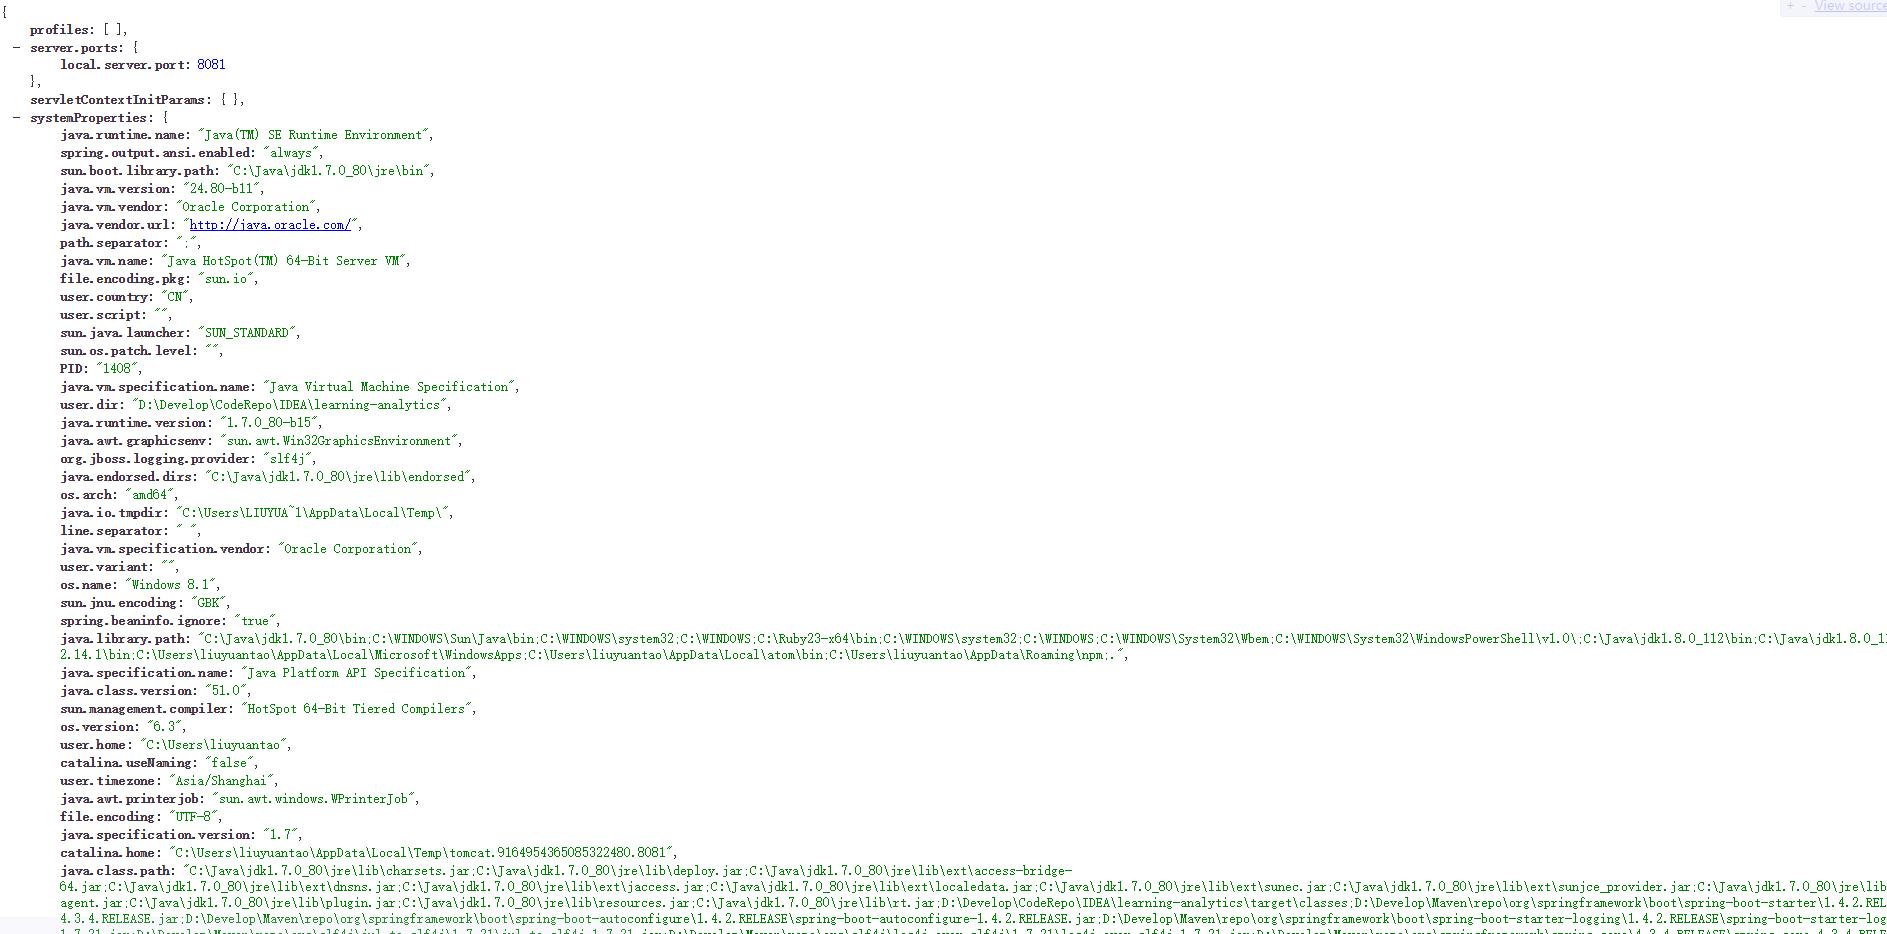
} 比如:http://localhost:8080/env
你可以得到所有环境变量结果


 1602
1602

 被折叠的 条评论
为什么被折叠?
被折叠的 条评论
为什么被折叠?
 到【灌水乐园】发言


