本例将使用思达商业智能平台Style Intelligence对房地产业进行分析。
新建工作表,导入数据源。数据为2014年1月-2015年6月房地产开发及销售情况的数据
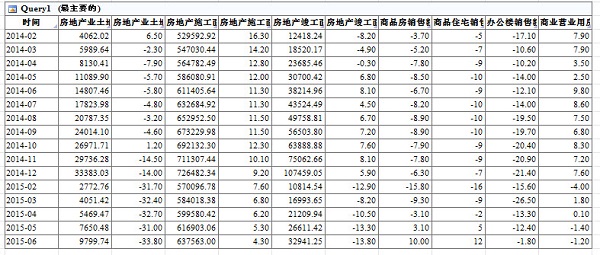
![思达BI工具Style](http://static.oschina.net/uploads/img/201507/22141434_XKrK.jpg)
一、房地产开发情况
拖拽图标控件到编辑区,绑定数据。制作土地购置面积累计值的柱状图,和土地购置面积累计增长折线图
![思达BI工具Style](http://static.oschina.net/uploads/img/201507/22141434_703v.jpg)
将两个图表组合起来,房地产土地购置面积分析图完成
![思达BI工具Style](http://static.oschina.net/uploads/img/201507/22141435_c1Of.jpg)
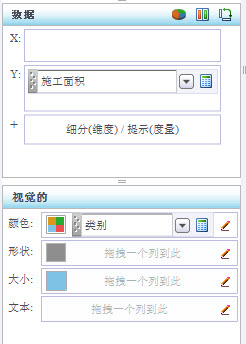
继续拖拽图表控件到编辑区,绑定数据。制作房地产施工/竣工面积累计值的柱状对比图
![思达BI工具Style](http://static.oschina.net/uploads/img/201507/22141435_VVCd.jpg)
再与施工/竣工面积累计增长折线图组合
![思达BI工具Style](http://static.oschina.net/uploads/img/201507/22141435_OSTC.jpg)
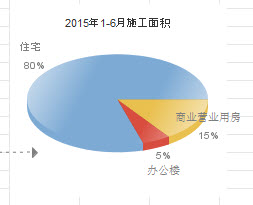
其中15年的施工面积:住宅施工面积444447万平方米,办公楼施工面积28363万平方米,商业营业用房施工面积85952万平方米
制作饼图
![思达BI工具Style](http://static.oschina.net/uploads/img/201507/22141435_YFlA.jpg)
![思达BI工具Style](http://static.oschina.net/uploads/img/201507/22141435_QyHS.jpg)
二、房地产销售情况
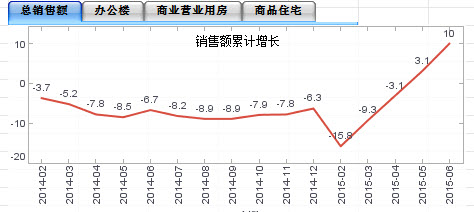
拖拽图表控件,分别制作总销售量、住宅、办公楼、商业营业用房销售量累计增长的折线图
![思达BI工具Style](http://static.oschina.net/uploads/img/201507/22141435_j2Jp.jpg)
将一个图表拖拽到另一个图表上,会弹出‘布局选线’对话框。选择‘作为同为组件重叠’
![思达BI工具Style](http://static.oschina.net/uploads/img/201507/22141435_LP9Y.jpg)
将四张销售量累计增长图全部重叠起来,销售额分析图制作完成
![思达BI工具Style](http://static.oschina.net/uploads/img/201507/22141435_DS9J.jpg)