


----java.awt.Graphics
----java.awt.Graphics2D
由于项目需要,要求对用户流程进行图形化展示:用户对自己的操作通过查看流程图一目了然。于是进行了一下前期的java绘图探索,通过java.awt.Graphics2D对绘制流程图的基本元素进行了编码,并将其展示在了jsp页面上。
首先编写一个servlet,然后在web.xml中对其进行配置,最后将图片展示在jsp页面。
1. 绘图方法:
- protected void doGet(HttpServletRequest request, HttpServletResponse response) throws ServletException, IOException {
- response.setContentType("image/jpeg");//声明文件格式
- //绘制宽=480,长=640的图板
- int width=480,hight=720;
- BufferedImage image = new BufferedImage(width,hight,BufferedImage.TYPE_INT_RGB);
- //获取图形上下文,graphics想象成一个画笔
- Graphics2D graphics = (Graphics2D)image.getGraphics();
- //消除线条锯齿
- graphics.setRenderingHint(RenderingHints.KEY_ANTIALIASING, RenderingHints.VALUE_ANTIALIAS_ON);
- //对指定的矩形区域填充颜色
- graphics.setColor(Color.ORANGE); //GREEN:绿色; 红色:RED; 灰色:GRAY
- graphics.fillRect(0, 0, 240, 720);
- //对指定的矩形区域填充颜色
- graphics.setColor(Color.PINK);
- graphics.fillRect(240, 0, 240, 720);
- //生成随机数
- Random random = new Random();
- /*
- * 画线 x,y是坐标,定义线段的两个坐标点
- */
- graphics.setColor(Color.BLACK);
- int x=100,y=100,x1=100,y1=y;
- graphics.drawLine(x,y,x+x1,y1);
- /*
- *画出一个折线
- */
- int[] xPoints = {100,100,250,250};
- int[] yPoints = {180,150,150,180};
- graphics.drawPolyline(xPoints, yPoints, 4);
- /*
- * 画出一个闭合多边形(三角形)
- */
- int[] xPoints1 = {100,100,200};
- int[] yPoints1 = {240,320,280};
- graphics.drawPolygon(xPoints1, yPoints1, 3);
- /*
- * 画出一个闭合多边形(菱形)
- */
- int[] xPoints2 = {240,300,360,300};
- int[] yPoints2 = {280,240,280,320};
- graphics.drawPolygon(xPoints2, yPoints2, 4);
- graphics.setColor(Color.ORANGE);
- graphics.fillPolygon(xPoints2, yPoints2, 4);
- /*
- *绘制一个椭圆形
- */
- graphics.setColor(Color.GREEN);
- int xOval=100,yOval=360;
- graphics.drawOval(xOval, yOval, 100, 100);
- /*
- *绘制一个矩形
- */
- //graphics.setColor(Color.GRAY);//--设置矩形边框颜色 。GREEN:绿色; 红色:RED; 灰色:GRAY
- int xRect=240,yRect=360;
- graphics.drawRect(xRect, yRect, 200, 100);
- //设置文字颜色
- graphics.setColor(new Color( 20+random.nextInt(100), 20+random.nextInt(100), 20+random.nextInt(100) ));
- //设置文字内容、位置
- graphics.drawString("直线",100+50,100-5);
- graphics.drawString("折线", 200, 150-5);
- graphics.drawString("空心三角形", 110, 280);
- graphics.drawString("实心菱形", 300-20, 280);
- graphics.drawString("椭圆形", 100+50, 360+50);
- graphics.drawString("矩形", 240+50, 360+50);
- //graphics.drawString("错误的背景颜色", 100, 540);
- //graphics.setPaintMode();
- //graphics.translate(400, 600);
- graphics.dispose();//释放此图形的上下文并释放它所使用的所有系统资源
- ImageIO.write(image,"JPEG",response.getOutputStream());
- PrintWriter out = response.getWriter();
- out.flush();
- out.close();
- //super.doGet(request, response);
- }
2. web.xml中配置servlet:
- <servlet>
- <servlet-name>graphics1</servlet-name>
- <servlet-class>hsy.graphics.test.GraphicsServlet</servlet-class>
- </servlet>
- <servlet-mapping>
- <servlet-name>graphics1</servlet-name>
- <url-pattern>/servlet/graphics1</url-pattern>
- </servlet-mapping>
3. Jsp页面中只需如下一句即可展示图形:
- <span style="white-space:pre"> </span><img id="" style="" src="../servlet/graphics1">
4.页面图形展示如下:
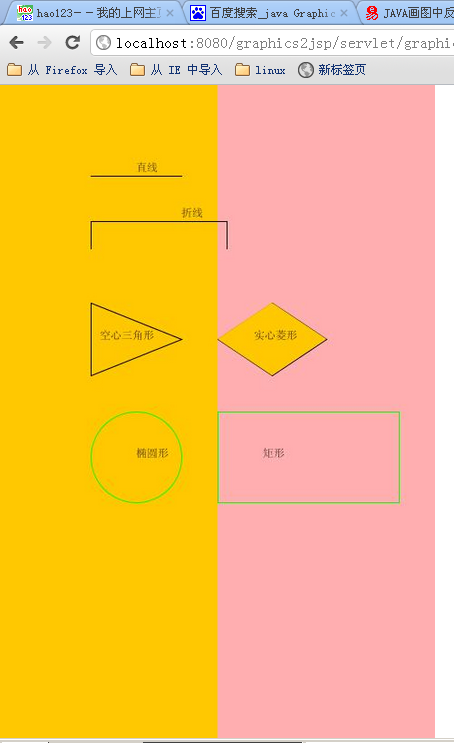
现在大家可以看看,充分发挥一下想象力,上图中是否包含了 ‘泳道’、‘开始节点’、‘结束节点’、’普通节点‘、‘流转线条’ 、‘描述文字’ 等一系列元素。那么剩下来的事情就是如何去绘制一个完整的流程图了,显然这不是一件简单的事情,但是有了这些基本的元素,再难应该也是可以绘制出来的。童鞋们,结合自己的项目,充分发挥你的想象力去完成流程图的绘制吧!


 7526
7526

 被折叠的 条评论
为什么被折叠?
被折叠的 条评论
为什么被折叠?
 到【灌水乐园】发言


