


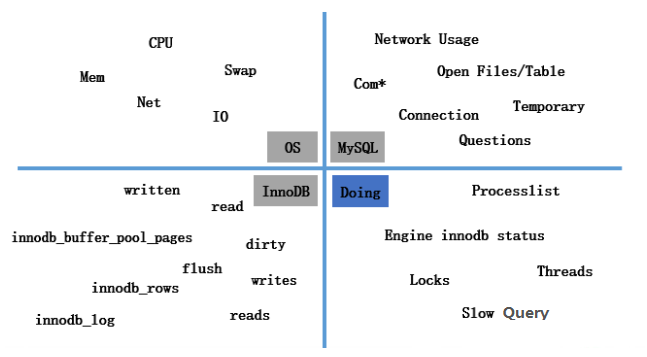
操作系统及MySQL数据库的实时性能状态数据尤为重要,特别是在有性能抖动的时候,这些实时的性能数据可以快速帮助你定位系统或MySQL数据库的性能瓶颈,就像你在Linux系统上使用「top,sar,iostat」等命令工具一样,可以立刻定位OS的性能瓶颈是在IO还是CPU上,所以收集/展示这些性能数据就更为重要,那都有哪些重要的实时性能状态指标可以反应出系统和MySQL数据库的性能负载呢?
目前在Linux跑MySQL是大多数互联网公司的标配,以上图片的性能数据指标项是我认为在Linux,MySQL,InnoDB中较为重要的实时状态数据,然而在以上图片Doing一栏其实更为重要,之所以把它叫做Doing,是因为「processlist,engine innodb status,locks」等指标项才真正反映了MySQL此时正在做什么。
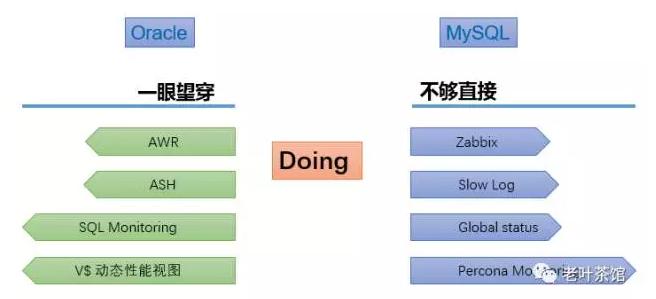
我们来对标Oracle数据库看一下,在Oracle数据库中提供了「AWR,ASH,SQL Monitor」等众多诊断工具,可以一眼望穿数据库正在做什么,甚至都可以知道在过去30天内任何一个时间区间的性能负载和当时数据库正在做什么。
在MySQL中虽然有像「zabbix,PMM」等优秀的监控工具,但它们只能反映数据库历史的一些性能数据曲线,例如,TPS高了,临时表使用多了,有InnoDB Deadlocks,但对于MySQL当时的Doing,我只能说不够直接。如果你在现场,你可以抓到MySQL正在做什么,但是,你总有不在现场的时候,如果问你昨天晚上数据库的性能抖动是什么原因?怎样快速重现现场找到引起抖动的原因呢?
答案是可以使用「doDBA tools」,这是一款免费的基于控制台的监控工具。
doDBA tools是什么?
doDBA tools是一个基于控制台的远程监控工具,它不需要在本地/远程系统上安装任何软件,它可以实时收集操作系统、MySQL、InnoDB的实时性能状态数据,并可以生成Doing日志文件,来帮助你快速了解/优化系统及MySQL数据库。
特点:
- golang语言开发。
- 可收集Linux、MySQL相关性能数据。
- 可本地或远程收集,可多台。
- 提供类似Linux top的mytop的功能。
- 基于并发生成Doing日志,还原现场。
- 可记录到日志文件。
doDBA tools工作原理
远程收集系统信息是通过ssh(需提供用户名和密码)的方式连接到远程服务器上收集,收集的方法都是通过读取Linux的proc下的等meminfo,diskstats,uptime,net,vmstat ,cpuinfo ,loadavg等文件,这和pmm,zabbix收集方式一致。
远程收集MySQL信息是通过 MySQL tcp连接到MySQL数据库上收集,只需要授予连接用户PROCESS、SELECT权限即可。
系统信息和MySQL信息的收集可以分离,如果只想收集系统信息,只需要提供系统用户名密码即可,如果只收集MySQL可以只提供MySQL连接信息,如果是rds用户,可以使用-rds参数,在使用mytop时会自动忽略系统信息的收集。
如何使用doDBA?
Github主页:https://github.com/dblucyne/dodba_tools
|
1
2
3
|
wget https://raw.githubusercontent.com/dblucyne/dodba_tools/master/doDBA --no-check-certificate
wget https://raw.githubusercontent.com/dblucyne/dodba_tools/master/doDBA.conf --no-check-certificate
chmod +x doDBA
|
下载下来就可以直接使用,不依赖于任何环境。但可以在doDBA.conf配置文件中先把需要设置的信息填写好。
|
1
2
3
4
5
6
7
8
9
|
{
"Host":"",
"Huser": "root",
"Hport": "22",
"Hpwd": "",
"Muser": "root",
"Mpwd": "123456",
"Mport":"3306"
}
|
使用帮助:
|
1
2
3
4
5
6
7
8
9
10
11
12
13
14
15
16
17
18
19
20
21
22
23
24
25
26
27
28
29
30
31
32
33
34
35
36
37
38
39
40
|
$ ./doDBA --help
Usage of ./doDBA:
-c string
configuration file. (default "doDBA.conf")
-h string
Connect to host/IP.
-hP string
Connect host port. (default "22")
-help
Display this help.
-hp string
Connect host password.
-hu string
Connect host user. (default "root")
-i duration
refresh interval in seconds. (default 1ns)
-innodb
Print innodb info.
-log
Print to file by day.
-mP string
Connect mysql port. (default "3306")
-mp string
Connect mysql password.
-mu string
Connect mysql user.
-myall
Print system and mysql info.
-mysql
Print mysql info.
-mytop
Print mysql prcesslist info , like top.
-nocolor
Print nocolor.
-rds
Ignore system info.
-sys
Print system info.
-t int
mysql trace on Threads_running. (default 50)
|
使用实例
1. 收集Linux性能数据
|
1
2
3
4
5
6
7
8
|
$ ./doDBA -h=127.0.0.1 -sys
DoDBA tools on host 127.0.0.1
---------+----load--avg----+-----cpu-usage-----+--swap--+----net----+-----------IO-----------
time | 1m 5m 10m| usr sys iow ide| si so| recv send| r/s w/s rb/s wb/s
---------+-----------------+-------------------+--------+-----------+------------------------
19:23:51 | 1.35 0.72 0.41| 4.2 3.0 3.2 89.6| 0 0|16384.0P16384.0P| 48 2396 768K 69.2M
19:23:52 | 1.35 0.72 0.41| 4.8 2.9 3.1 89.2| 0 0|16384.0P16384.0P| 68 2502 1.1M 71.1M
|
2. 收集MySQL性能数据
|
1
2
3
4
5
6
7
8
9
|
$ ./doDBA -h=127.0.0.1 -mysql
DoDBA tools on host 127.0.0.1
---------+-------mysql-status-------+-----threads-----+-----slow-----+---bytes---+---------locks----------
time | QPS TPS ins upd del| run con cre cac| sql tmp Dtmp| recv send| lockI lockW openT openF
---------+--------------------------+-----------------+--------------+-----------+------------------------
19:27:32 | 25 11 0 11 0| 3 99 0 6| 0 1 0| 5K 37K| 36 0 538 93
19:27:33 | 37 152 13 5 134| 3 99 0 6| 0 5 1| 35K 396K| 216 0 538 93
19:27:34 | 39 60 8 8 44| 4 99 0 6| 0 5 0| 26K 220K| 115 0 538 93
|
3. 收集InnoDB性能数据
|
1
2
3
4
5
6
7
8
9
|
$ ./doDBA -h=127.0.0.1 -innodb
DoDBA tools on host 127.0.0.1
---------+------innodb--rows-----+---------innodb--pages--------+-------innodb--data-------+--innodb-log--
time | read ins upd del| data free dirty flush|reads writes read written|fsyncs written
---------+-----------------------+------------------------------+--------------------------+--------------
19:30:00 | 4741 458 32 0| 350602 8195 18869 125| 0 141 0K 4.0M| 1 66K
19:30:01 | 106 521 3 0| 350602 8195 18858 137| 0 151 0K 4.4M| 1 72K
19:30:02 | 7982 406 40 2| 350603 8194 18860 160| 0 202 0K 5.1M| 3 84K
|
4. 收集MySQL及Linux性能数据
|
1
|
$ ./doDBA -h 127.0.0.1 -myall
|
5. mytop –like linux top
|
1
2
3
4
5
6
7
8
9
10
11
|
$ ./doDBA -h 127.0.0.1 -mytop
DoDBA tools -19:32:36 on host 127.0.0.1 UP 61 days Load: 0.64 0.75 0.63
CPU: 1.99% user, 2.84% sys, 0.00% nice, 0.28% iowait, 94.89% idle
Mem: 23.3G total, 23.0G used, 317.6M free, 0K buffers
Swap: 24.0G total, 0K used, 24.0G free, 13.2G Cached
MySQL: 16 QPS, 20 TPS, 0 slowSQL, 2 run
ID USER IP/HOST DB Time State SQL
-- ---- ------- -- ---- ----- ---
2495440 zabbix 127.0.0.1 0 init show full processlist
|
6. 借助Shell收集多台
|
1
2
3
|
$ cat ip.txt
10.1.x.x1
10.1.x.x2
|
Shell
|
1
2
3
4
5
|
$ cat ip.txt |
while read ip; do
echo $ip;
./doDBA -h=$ip -mysql -log </dev/null &
done
|
7. 收集到日志文件
|
1
2
3
4
5
6
7
8
9
|
$ ./doDBA -h=127.0.0.1 -mysql -log
$ cat 127001_dodba_mysql_20161219.log
DoDBA tools on host 127.0.0.1
---------+-------mysql-status-------+-----threads-----+-----slow-----+---bytes---+---------locks----------
time | QPS TPS ins upd del| run con cre cac| sql tmp Dtmp| recv send| lockI lockW openT openF
---------+--------------------------+-----------------+--------------+-----------+------------------------
19:35:30 | 23 15 10 5 0| 3 98 0 7| 0 2 1| 9K 8.0M| 43 0 538 95
19:35:31 | 53 19 5 14 0| 2 98 0 7| 0 3 0| 38K 1.7M| 86 0 538 93
|
8. 开启Doing功能
使用【-t】参数可以基于Threads_running的数量设置阈值,设置后可记录「processlist,engine innodb status」信息到dodba.log日志中,–重现现场。
|
1
|
$ ./doDBA -h=127.0.0.1 -mysql -t=3
|
9. 查看Doing日志
|
1
2
3
4
5
6
7
8
9
10
|
$ tail -f dodba.log
2016/12/19 19:51:52 ----------------processlist---------------
ID:2314306
User:zabbix
Host:localhost
DB:zabbix
Command:Query
Time:0
State:update
Info:insert into history_uint (itemid,clock,ns,value) values (35632,1482148312,240404292,274)
|


 850
850

 被折叠的 条评论
为什么被折叠?
被折叠的 条评论
为什么被折叠?
 到【灌水乐园】发言


