一、EChars学习官网:http://echarts.baidu.com/
二、具体实现js脚本:
function clock(id){
// 路径配置
require.config( {
paths : {
echarts : 'js/build/dist'
}
});
//画图
require( [ 'echarts', 'echarts/chart/gauge' ],//仪表盘需要的文件
function(ec) {
// 基于准备好的dom,初始化echarts图表
var myChart = ec.init(document.getElementById(id));
var option={
series:[
//时针和表盘绘制
{
name:'时',
type:'gauge',
//表盘最小值
min:0,
//表盘最大值
max:12,
//表盘分割数
splitNumber:12,
//圆心位置
center:['50%','50%'],
//半径
radius:100,
//指针起始角度
startAngle:90,
//指针结束角度
endAngle:-270,
//指针方向
clockWise:true,
title:false,
//表盘外框
axisLine: {
show:true,
lineStyle:{
color:[
[0.25,'#48D1CC'],
[0.5,'#EE6A50'],
[0.75,'#3A5FCD'],
[1,'#00EE00'],
],
width:10
},
//表盘细分数
axisTick:{
show:true,
splitNumber: 5,
length :18,
lineStyle: {
color: '#eee',
width: 1,
type: 'solid',
},
},
//分割线
splitLine: {
show: true,
length :20,
lineStyle: {
color: '#eee',
width: 2,
type: 'solid'
}
}
},
//分割线标识
axisLabel:{
show:true,
formatter:function(v){
switch(v+''){
case'0':return '12';
case'12':return '12';
default: return v;
}
}
},
//指针设置
pointer:{
length:'40%',
width:8
},
detail : {
show:false
},
//初始值
data:[{value:0, name: '时'}]
},
//分针
{
name:'分',
type:'gauge',
min:0,
max:60,
splitNumber:60,
center:['50%','50%'],
radius:100,
startAngle:90,
endAngle:-270,
clockWise:true,
title:false,
axisLine: {
show:true,
lineStyle:{
color:[
[0.25,'#48D1CC'],
[0.5,'#EE6A50'],
[0.75,'#3A5FCD'],
[1,'#00EE00'],
],
width:0
},
},
axisTick:{
show:false,
},
splitLine: {
show: false,
},
axisLabel:{
show:true,
formatter:function(v){
switch(v+''){
default: return '';
}
}
},
pointer:{
length:'60%',
width:5
},
detail : {
show:false
},
data:[{value:0, name: '分'}]
},
//秒针
{
name:'秒',
type:'gauge',
min:0,
max:60,
splitNumber:60,
center:['50%','50%'],
radius:100,
startAngle:90,
endAngle:-270,
clockWise:true,
title:false,
axisLine: {
show:true,
lineStyle:{
color:[
[0.25,'#48D1CC'],
[0.5,'#EE6A50'],
[0.75,'#3A5FCD'],
[1,'#00EE00'],
],
width:0
},
},
axisTick:{
show:false,
},
splitLine: {
show: false,
},
axisLabel:{
show:true,
formatter:function(v){
switch(v+''){
default: return '';
}
}
},
pointer:{
length:'85%',
width:3
},
detail : {
show:false
},
data:[{value: 0, name: '秒'}]
}
]
};
//每秒绘制指针位置
clearInterval(timeTicket);
var timeTicket = setInterval(function(){
var d = new Date();
var h=d.getHours();
if(h>12){
h=h-12;
};
option.series[0].data[0].value = h;
option.series[1].data[0].value = d.getMinutes();
option.series[2].data[0].value = d.getSeconds();
myChart.setOption(option, true);
},1000);
});
};
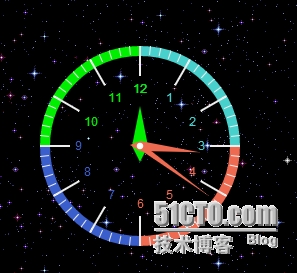
三、效果图:

四:缺陷
本例子是仪表盘使用的参考,存在一个动画问题(指针结束一周后进入下一周时的动画效果有bug),有兴趣可以自己研究,修改一下,欢迎提出建议。
转载于:https://blog.51cto.com/qyhlipwan/1689245


 2265
2265


 被折叠的 条评论
为什么被折叠?


