


112个人参加了六各测验,包括非语言的普通智力测试general)、画图测试(picture)、积木图案测试(blocks)、迷宫测验(maze)、阅读测验(reading)和词汇测验(vocab),
潜在的心理学因素来解释参与者的测验得分?
数据集 ability.cov 提供了变量的协方差矩阵,你可以用 cov2cor() 函数将其转化为相关系数矩阵。数据集没有缺失值
> options(digits =2)
> covariances <- ability.cov$cov
> correlations <- cov2cor(covariances) #相关系数矩阵
> correlations
        general picture blocks maze reading vocab
general    1.00    0.47   0.55 0.34    0.58  0.51
picture    0.47    1.00   0.57 0.19    0.26  0.24
blocks     0.55    0.57   1.00 0.45    0.35  0.36
maze       0.34    0.19   0.45 1.00    0.18  0.22
reading    0.58    0.26   0.35 0.18    1.00  0.79
vocab      0.51    0.24   0.36 0.22    0.79  1.00
x
1
> options(digits =2)
2
> covariances <- ability.cov$cov
3
> correlations <- cov2cor(covariances) #相关系数矩阵
4
> correlations
5
general picture blocks maze reading vocab
6
general 1.00 0.47 0.55 0.34 0.58 0.51
7
picture 0.47 1.00 0.57 0.19 0.26 0.24
8
blocks 0.55 0.57 1.00 0.45 0.35 0.36
9
maze 0.34 0.19 0.45 1.00 0.18 0.22
10
reading 0.58 0.26 0.35 0.18 1.00 0.79
11
vocab 0.51 0.24 0.36 0.22 0.79 1.00
因为要寻求用来
解释数据的潜在结构,可使用 EFA 方法。与使用 PCA 相同,下一步工作为判断需要提取几个因子
- fa.parallel()
可以判断提取的因子数
library(psych)
covariances <- ability.cov$cov
correlations <- cov2cor(covariances)     #将协方差矩阵转化为相关系数矩阵
fa.parallel(correlations,
            n.obs=112,                   #获取样本量
            fa="both",                   #PCA和EFA都画出
            n.iter = 100,                #模拟100次
            show.legend = F,
            #show.legend=T,
            #legend=legend("topleft"),
            main = "Scree plot with parallel analysis")
x
1
library(psych)
2
covariances <- ability.cov$cov
3
correlations <- cov2cor(covariances) #将协方差矩阵转化为相关系数矩阵
4
fa.parallel(correlations,
5
n.obs=112, #获取样本量
6
fa="both", #PCA和EFA都画出
7
n.iter = 100, #模拟100次
8
show.legend = F,
9
#show.legend=T,
10
#legend=legend("topleft"),
11
main = "Scree plot with parallel analysis")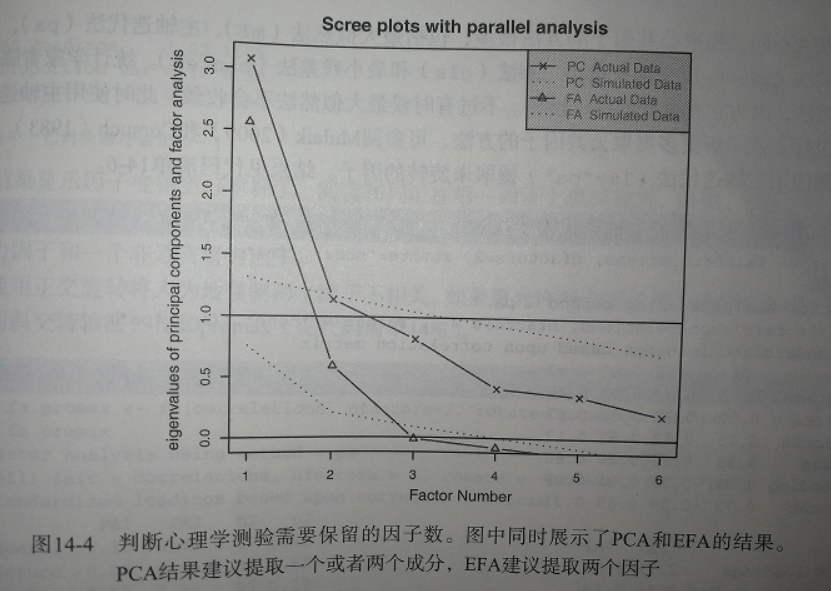
a、代码中 fa=both ,因子图形将会同时展示PCA、EFA
b、如果使用PCA方法,可以选择一个成分(碎石检验和平行分析)或者两个检验(特征值大于1),当摇摆不定时,高估因子通常比低估因子数的结果好,因为高估因子数一般较少曲解“真实”情况
c、
对于 EFA ,kaiser-Harris准则的特许值大于0,而不是1,图中该准则建议选择两个因子


 3430
3430

 被折叠的 条评论
为什么被折叠?
被折叠的 条评论
为什么被折叠?
 到【灌水乐园】发言


