


import numpy as np
import pandas as pd
import matplotlib.pyplot as plt
from pandas import Series,DataFrame
import seaborn as sns
from scipy import stats
np.random.randn(144)
np.set_printoptions(precision=3)
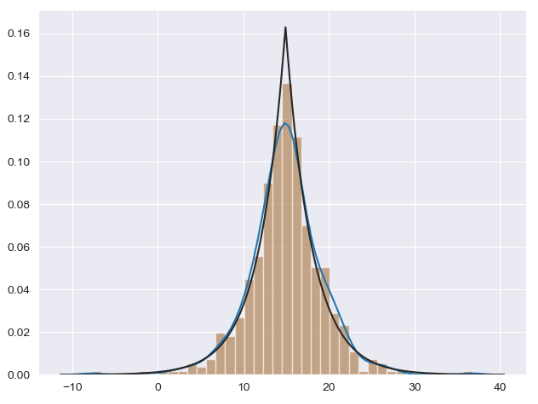
d = np.random.laplace(loc=15, scale=3, size=500)
sns.set_style('darkgrid')
sns.distplot(d)
sns.distplot(d, fit=stats.laplace, kde=False)
plt.show()效果图:


 5540
5540


 被折叠的 条评论
为什么被折叠?
被折叠的 条评论
为什么被折叠?
 到【灌水乐园】发言


