


join计算的代价很高吗?
看情况
join的代价依赖于join的条件,索引是什么样,依赖于表有多大,相关信息是否已经cache住了,使用的什么硬件,配置参数的信息,统计信息是否已经更新,同时是否还有其他运行的计算……
晕了?别急!在以下情景下,我们依然可以找到一些规律来分析判断:
- 随着join的表的数量增加
- 随着这些表的行数的增加
- 有没有索引
此类情况,在工作中经常会碰到,比如:如果有一张产品表 product,但业务上需要加入一个产品的状态,包括Active、Discontinued、Recalled等。此时,我们会有3种不同的做法:
- 在产品表 product 中,增加一列状态号 status_id,同时增加一个新的状态表 status。
- 在产品表 product 中,增加一列状态号 status_id,同时让应用来定义每个状态号 status_id 对应的含义及显示。
- 在产品表 product 中,增加一列文本列,用来描述状态信息。
通常,我们会选择第一个做法。关于后两种的做法,通常的质疑在两个方面:join的性能和开发人员的工程化能力。后者通常与个人喜好有关,姑且不谈,咱们来一起讨论一下join的性能问题。
为便于讨论,选用PostgreSQL测试数据来讨论。以等值连接为例,让我们看看执行上面的join时,性能会有什么变化?我们担心的性能变慢,那具体会变成多慢。
以下是用来生成测试用的建表语句。
DROP FUNCTION IF EXISTS create_tables(integer, integer, boolean);
CREATE FUNCTION create_tables(num_tables integer, num_rows integer, create_indexes boolean) RETURNS void AS $function_text$
BEGIN

-- There's no table before the first one, so this one's a little different.  Create it here instead of in our loop.
DROP TABLE IF EXISTS table_1 CASCADE;
CREATE TABLE table_1 (
    id serial primary key
);

-- Populate the first table
INSERT INTO table_1 (id)
SELECT
    nextval('table_1_id_seq')
FROM
    generate_series(1, num_rows);

-- Create and populate all the other tables
FOR i IN 2..num_tables LOOP
    EXECUTE 'DROP TABLE IF EXISTS table_' || i || ' CASCADE;';

    EXECUTE format($$
        CREATE TABLE table_%1$s (
            id serial primary key,
            table_%2$s_id integer references table_%2$s (id)
        );

        INSERT INTO table_%1$s (table_%2$s_id)
        SELECT
            id
        FROM
            table_%2$s
        ORDER BY
            random();
    $$, i, i-1);

    IF create_indexes THEN
        EXECUTE 'CREATE INDEX ON table_' || i || ' (table_' || i - 1 || '_id);';
    END IF;
END LOOP;
END;
$function_text$ LANGUAGE plpgsql;

-- We'll want to make sure PostgreSQL has an idea of what's in these tables
DROP FUNCTION IF EXISTS analyze_tables(integer);
CREATE FUNCTION analyze_tables(num_tables integer) RETURNS void AS $function_text$
BEGIN

FOR i IN 1..num_tables LOOP
    EXECUTE 'ANALYZE table_' || i || ';';
END LOOP;
END;
$function_text$ LANGUAGE plpgsql;
执行建表函数……
SELECT create_tables(10, 10000, False);

SELECT * from table_1 limit 10;


id
----
  1
  2
  3
  4
  5
  6
  7
  8
  9
 10
(10 rows)


SELECT * from table_2 limit 10;

 id | table_1_id
----+------------
  1 |        824
  2 |        973
  3 |        859
  4 |        789
  5 |        901
  6 |        112
  7 |        162
  8 |        212
  9 |        333
 10 |        577
(10 rows)
OK,现在我们可以任意创建所需要的表了。
我们还需要方法来查询,以测试join的性能。有一些不错的长查询,但我们不希望手工来编写,于是我们创建了另一个函数来生成它们。只需要告诉它有多少表参与join,以及where子句中最后一张表的最大的id,它就可以执行了。
DROP FUNCTION IF EXISTS get_query(integer, integer);
CREATE FUNCTION get_query(num_tables integer, max_id integer) RETURNS text AS $function_text$
DECLARE
    first_part text;
    second_part text;
    third_part text;
    where_clause text;
BEGIN

first_part := $query$
        SELECT
            count(*)
        FROM
            table_1 AS t1 INNER JOIN$query$;

second_part := '';

FOR i IN 2..num_tables-1 LOOP
    second_part := second_part || format($query$
            table_%1$s AS t%1$s ON
                t%2$s.id = t%1$s.table_%2$s_id INNER JOIN$query$, i, i-1);
END LOOP;

third_part := format($query$
            table_%1$s AS t%1$s ON
                t%2$s.id = t%1$s.table_%2$s_id
        WHERE
            t1.id <= %3$s$query$, num_tables, num_tables-1, max_id);

RETURN first_part || second_part || third_part || ';';
END;
$function_text$ LANGUAGE plpgsql;
下面是一个生成查询的示例。
SELECT get_query(5, 10);

                  get_query
--------------------------------------------------
                                                 +
         SELECT                                  +
             count(*)                            +
         FROM                                    +
             table_1 AS t1 INNER JOIN            +
             table_2 AS t2 ON                    +
                 t1.id = t2.table_1_id INNER JOIN+
             table_3 AS t3 ON                    +
                 t2.id = t3.table_2_id INNER JOIN+
             table_4 AS t4 ON                    +
                 t3.id = t4.table_3_id INNER JOIN+
             table_5 AS t5 ON                    +
                 t4.id = t5.table_4_id           +
         WHERE                                   +
             t1.id <= 10;
(1 row)

Time: 1.404 ms
OK,让我们花一些时间来思考一下,当我们运行这条查询时,我们实际让Postgres做了哪些事情。在这条SQL中,我们在询问表 table_5 中的 table_4_id 列有多少在表 table_4中,而且表 table_4 中 table_3_id 列有多少在表 table_2 中,而且表 table_2 中 table_1_id 列有多少在表 table_1 中,而且 table_1_id 小于等于10。
我们继续运行……
SELECT
    count(*)
FROM
    table_1 AS t1 INNER JOIN
    table_2 AS t2 ON
        t1.id = t2.table_1_id INNER JOIN
    table_3 AS t3 ON
        t2.id = t3.table_2_id INNER JOIN
    table_4 AS t4 ON
        t3.id = t4.table_3_id INNER JOIN
    table_5 AS t5 ON
        t4.id = t5.table_4_id
WHERE
    t1.id <= 10;

count
-------
   10
(1 row)

Time: 40.494 ms
我们可以通过抛出 EXPLAIN ANALYZE 来查看进展。
EXPLAIN ANALYZE
SELECT
    count(*)
FROM
    table_1 AS t1 INNER JOIN
    table_2 AS t2 ON
        t1.id = t2.table_1_id INNER JOIN
    table_3 AS t3 ON
        t2.id = t3.table_2_id INNER JOIN
    table_4 AS t4 ON
        t3.id = t4.table_3_id INNER JOIN
    table_5 AS t5 ON
        t4.id = t5.table_4_id
WHERE
    t1.id <= 10;

                                                                                     QUERY PLAN
-------------------------------------------------------------------------------------------------------------------------------------------------------------------------------------
 Aggregate  (cost=827.93..827.94 rows=1 width=8) (actual time=43.392..43.392 rows=1 loops=1)
   ->  Hash Join  (cost=645.31..827.90 rows=9 width=0) (actual time=35.221..43.353 rows=10 loops=1)
         Hash Cond: (t5.table_4_id = t4.id)
         ->  Seq Scan on table_5 t5  (cost=0.00..145.00 rows=10000 width=4) (actual time=0.024..3.984 rows=10000 loops=1)
         ->  Hash  (cost=645.20..645.20 rows=9 width=4) (actual time=34.421..34.421 rows=10 loops=1)
               Buckets: 1024  Batches: 1  Memory Usage: 9kB
               ->  Hash Join  (cost=462.61..645.20 rows=9 width=4) (actual time=25.281..34.357 rows=10 loops=1)
                     Hash Cond: (t4.table_3_id = t3.id)
                     ->  Seq Scan on table_4 t4  (cost=0.00..145.00 rows=10000 width=8) (actual time=0.022..4.828 rows=10000 loops=1)
                     ->  Hash  (cost=462.50..462.50 rows=9 width=4) (actual time=23.519..23.519 rows=10 loops=1)
                           Buckets: 1024  Batches: 1  Memory Usage: 9kB
                           ->  Hash Join  (cost=279.91..462.50 rows=9 width=4) (actual time=12.617..23.453 rows=10 loops=1)
                                 Hash Cond: (t3.table_2_id = t2.id)
                                 ->  Seq Scan on table_3 t3  (cost=0.00..145.00 rows=10000 width=8) (actual time=0.017..5.065 rows=10000 loops=1)
                                 ->  Hash  (cost=279.80..279.80 rows=9 width=4) (actual time=12.221..12.221 rows=10 loops=1)
                                       Buckets: 1024  Batches: 1  Memory Usage: 9kB
                                       ->  Hash Join  (cost=8.55..279.80 rows=9 width=4) (actual time=0.293..12.177 rows=10 loops=1)
                                             Hash Cond: (t2.table_1_id = t1.id)
                                             ->  Seq Scan on table_2 t2  (cost=0.00..145.00 rows=10000 width=8) (actual time=0.017..5.407 rows=10000 loops=1)
                                             ->  Hash  (cost=8.44..8.44 rows=9 width=4) (actual time=0.054..0.054 rows=10 loops=1)
                                                   Buckets: 1024  Batches: 1  Memory Usage: 9kB
                                                   ->  Index Only Scan using table_1_pkey on table_1 t1  (cost=0.29..8.44 rows=9 width=4) (actual time=0.024..0.035 rows=10 loops=1)
                                                         Index Cond: (id <= 10)
                                                         Heap Fetches: 10
 Planning time: 1.659 ms
 Execution time: 43.585 ms
(26 rows)
我们可以看到,除了使用 表table_1的主键索引外,都是顺序扫描。它还可以怎么做呢?因为我们没有建任何索引来优化它。
如果我们重新做这个实验,告诉* create_tables()*去创建索引……
SELECT create_tables(10, 10000, True);
重新运行后,我们得到不同的查询计划。
EXPLAIN ANALYZE
SELECT
    count(*)
FROM
    table_1 AS t1 INNER JOIN
    table_2 AS t2 ON
        t1.id = t2.table_1_id INNER JOIN
    table_3 AS t3 ON
        t2.id = t3.table_2_id INNER JOIN
    table_4 AS t4 ON
        t3.id = t4.table_3_id INNER JOIN
    table_5 AS t5 ON
        t4.id = t5.table_4_id
WHERE
    t1.id <= 10;

                                                                            QUERY PLAN
------------------------------------------------------------------------------------------------------------------------------------------------------------------
 Aggregate  (cost=88.52..88.53 rows=1 width=8) (actual time=0.411..0.411 rows=1 loops=1)
   ->  Nested Loop  (cost=1.43..88.50 rows=9 width=0) (actual time=0.067..0.399 rows=10 loops=1)
         ->  Nested Loop  (cost=1.14..85.42 rows=9 width=4) (actual time=0.054..0.304 rows=10 loops=1)
               ->  Nested Loop  (cost=0.86..82.34 rows=9 width=4) (actual time=0.043..0.214 rows=10 loops=1)
                     ->  Nested Loop  (cost=0.57..79.25 rows=9 width=4) (actual time=0.032..0.113 rows=10 loops=1)
                           ->  Index Only Scan using table_1_pkey on table_1 t1  (cost=0.29..8.44 rows=9 width=4) (actual time=0.015..0.023 rows=10 loops=1)
                                 Index Cond: (id <= 10)
                                 Heap Fetches: 10
                           ->  Index Scan using table_2_table_1_id_idx on table_2 t2  (cost=0.29..7.86 rows=1 width=8) (actual time=0.007..0.007 rows=1 loops=10)
                                 Index Cond: (table_1_id = t1.id)
                     ->  Index Scan using table_3_table_2_id_idx on table_3 t3  (cost=0.29..0.33 rows=1 width=8) (actual time=0.008..0.008 rows=1 loops=10)
                           Index Cond: (table_2_id = t2.id)
               ->  Index Scan using table_4_table_3_id_idx on table_4 t4  (cost=0.29..0.33 rows=1 width=8) (actual time=0.007..0.008 rows=1 loops=10)
                     Index Cond: (table_3_id = t3.id)
         ->  Index Only Scan using table_5_table_4_id_idx on table_5 t5  (cost=0.29..0.33 rows=1 width=4) (actual time=0.007..0.008 rows=1 loops=10)
               Index Cond: (table_4_id = t4.id)
               Heap Fetches: 10
 Planning time: 2.287 ms
 Execution time: 0.546 ms
(19 rows)
结果是使用来索引,速度快了很多。而且这与我们预期的一致。我们现在准备将这些混到一起,看看随着表和列数量的增加时会有什么变化?
需要说明一下,这些测试是运行在AWS RDS db.m4.large实例上。这是最便宜的实例,而且也不会在性能上自动扩容,所以可以作为基准。我们共运行10次,取平均值。
最初的查询,join涉及的表数量从2到200,包含3种行设置,而且没有索引。
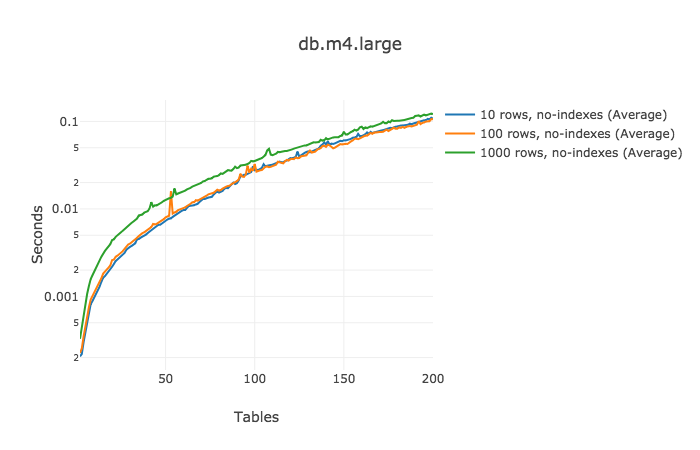
性能还是不错的。更为重要的是,我们可以计算每个增加的join的成本!对于100行的表,下面的数据显示了每次增加表所带来的执行时间的增加:
| 表的数量 | 平均增加量 | 时间(ms) |
|---|---|---|
| 2-50 | (0.012738 - 0.000327) / (50 - 2) = | 0.259 |
| 50-100 | (0.0353395 - 0.012738) / (100 - 50) = | 0.452 |
| 100-150 | (0.0762056 - 0.0353395) / (150 - 100) = | 0.817 |
| 150-200 | (0.1211591 - 0.0762056) / (200 - 150) = | 0.899 |
甚至在参与join的表数量已经接近200时,每增加一个表只增加少于1ms的执行时间。
在讨论增加一个表用来存储产品的状态时,表增加至1000行时就过载了。所以,不考虑索引的情况下,增加一个引用的表并不会对性能产生实质性影响。
由于之前所做的基准测试的数据量不大,如果碰到大表呢?我们重新做了相同的测试,但这次每张表都包含一百万行。这次只增加到50张表。为什么?运行它需要一段时间,我只有有限都预算和耐心
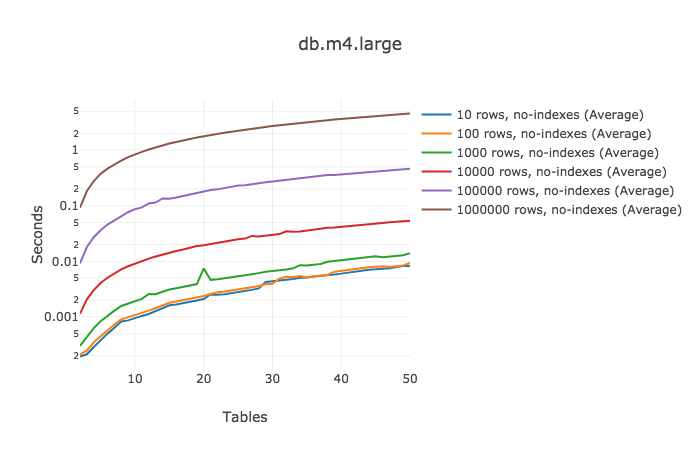
这次运行结果曲线就没有重叠了。请看最大的1百万行的表,每增加1张join的表,它需要多运行93ms。
| 表的数量 | 平均增加量 | 时间(ms) |
|---|---|---|
| 2-10 | (0.8428495 - 0.0924571) / (10 - 2) = | 93.799 |
| 10-20 | (1.781959 - 0.8428495) / (20 - 10) = | 93.911 |
| 20-30 | (2.708342 - 1.781959) / (30 - 20) = | 92.638 |
| 30-40 | (3.649164 - 2.708342) / (40 - 30) = | 94.082 |
| 40-50 | (4.565644 - 3.649164) / (50 - 40) = | 91.648 |
此次都是顺序扫描,因此我们增加索引,看看会有什么变化?
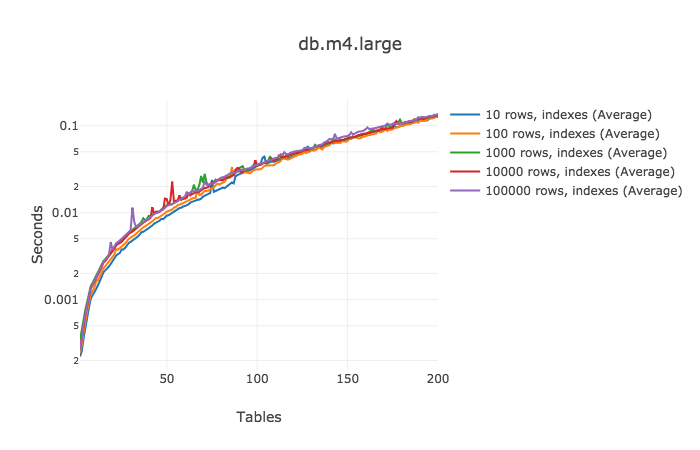
增加索引后,性能影响很显著。当能使用到索引时,不管表中有多少行,测试结果都差不多。针对10万行的表的查询一般最慢,但并总是最慢。
| 表的数量 | 平均增加量 | 时间(ms) |
|---|---|---|
| 2-50 | (0.0119917 - 0.000265) / (50 - 2) = | 0.244 |
| 50-100 | (0.035345 - 0.0119917) / (100 - 50) = | 0.467 |
| 100-150 | (0.0759236 - 0.035345) / (150 - 100) = 92.638 | 0.811 |
| 150-200 | (0.1378461 - 0.0759236) / (200 - 150) = | 1.238 |
即使查询已经涉及到150张表,此时增加1一张表只会增加1.2ms。
最后一个测试场景,由于历时太长,等不及生成200个1百万行的表及建立索引,但又想观察性能的变化,于是选择测试50张表时的结果……
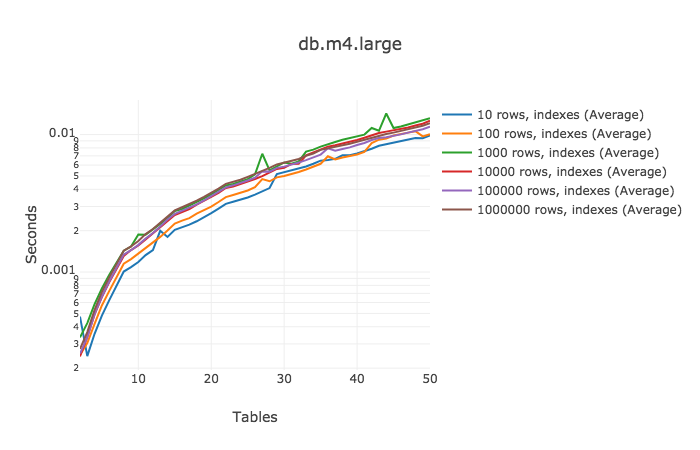
| 表的数量 | 平均增加量 | 时间(ms) |
|---|---|---|
| 2-10 | (0.0016811 - 0.000276) / (10 - 2) = | 0.176 |
| 10-20 | (0.003771 - 0.0016811) / (20 - 10) = | 0.209 |
| 20-30 | (0.0062328 - 0.003771) / (30 - 20) = | 0.246 |
| 30-40 | (0.0088621 - 0.0062328) / (40 - 30) = | 0.263 |
| 40-50 | (0.0120818 - 0.0088621) / (50 - 40) = | 0.322 |
基于之前增加索引带来的性能改进结果,这次并没有带来太多的性能惊喜。50张1百万行的表做join,只需要12ms。Cool!
也许这些额外的join操作的成本比我们预想的要低一些,但有件事需要我们去考虑,虽然每个增加的join运算所占用的时间很小,但越多的表意味着越多的查询计划需要考虑,这很可能会导致很难找到最佳的查询计划。例如,当join的数量超过 geqo_threshold 时(默认为12),postgres 会停止参考所有可能的查询计划,改为使用通用算法。这会改变查询计划,引起对性能的负面影响。
由于每个系统的业务千差万别,一定要基于你的数据来测试你的查询。虽然我们看到增加join的成本很低,但仍然非常有必要去规范你的数据。
[原文] Cost of a Join
非直译,仅为增加乐趣,向作者的严谨性致敬。


 1112
1112

 被折叠的 条评论
为什么被折叠?
被折叠的 条评论
为什么被折叠?
 到【灌水乐园】发言


