


昨天花了一天的时间去搞Multiple图形,今天总结下在使用过程中的一些注意点。
PS:Multiple-多重的;多样的;
对于有下面几种的Multiple图形
- MultipleAxis-涉及到多重坐标轴的图表
- MultipleDataset-涉及到多条dataset数据源的图表
- MultiplePie-涉及到多个饼图的图表
MultipleAxis-涉及到多重坐标轴的图表
首先我们先来介绍下多个坐标轴的图表,包括多个横坐标或者多个纵坐标。
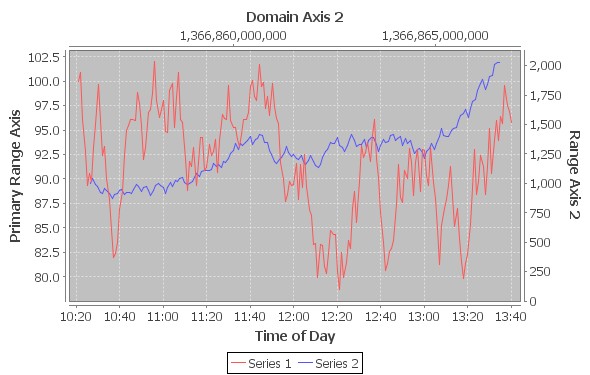
图中我们可以看出,图表是包含两条横坐标,两条纵坐标。
我们如何去实现多条坐标的呢?
我们知道在创建JFreeChart对象的时候,会初始化一条横坐标和一条纵坐标的,我们可以这样的添加第二条纵坐标
- 首先,创建一个坐标对象(Axis)
NumberAxis axis2 = new NumberAxis("Range Axis 2");
		axis2.setFixedDimension(10.0);
		axis2.setAutoRangeIncludesZero(false);
		axis2.setLabelPaint(Color.red);
axis2.setTickLabelPaint(Color.red);- 然后我们通过图表区域对象Polt来添加第二条纵坐标
//创建图表区域对象
XYPlot plot = (XYPlot) chart.getPlot();
//将创建的轴的对象添加到图表区域对象里面去。
plot.setRangeAxis(1, axis2);
//设置轴显示的位置
plot.setRangeAxisLocation(1, AxisLocation.BOTTOM_OR_LEFT);
也可以使用XYItemRenderer对象给你所创建的axis对象添加效果。
XYItemRenderer renderer3 = new StandardXYItemRenderer();
renderer3.setSeriesPaint(0, Color.blue);
//给对应这的axis对象添加renderer效果
plot.setRenderer(2, renderer3);
MultipleDataset-涉及到多条dataset数据源的图表
下面来谈谈使用多条dataset数据源的图表

实现多个dataset的方式(区别与一个dataset里面含有多条数据)
- 首先是,创建第一条数据源
TimeSeriesCollection dataset1 = createRandomDataset("Series 1");
 JFreeChart chart = ChartFactory.createTimeSeriesChart(
"Multiple Dataset Demo 1", "Time", "Value", dataset1, true, true, false);- 然后我们可以通过全局的图表区域对象plot的setDataset()方法来实现对于数据源的添加
//添加数据源
this.plot.setDataset(this.datasetIndex, createRandomDataset(   "S" + this.datasetIndex ));
//添加相对应的数据源的renderer对象。
this.plot.setRenderer( this.datasetIndex, new StandardXYItemRenderer()
);//删除指定Id的数据源
this.plot.setDataset(this.datasetIndex, null);
this.plot.setRenderer(this.datasetIndex, null);MultiplePie-涉及到多个饼图的图表
对于多个饼图,区别于之前的一个饼图的创建方式。

- 首先数据源的创建,使用的dataset对象是DatasetUtilities.createCategoryDataset()
double[][] data = new double[][] {
            {3.0, 4.0, 3.0, 5.0},
            {5.0, 7.0, 6.0, 8.0},
            {5.0, 7.0, Double.NaN, 3.0},
            {1.0, 2.0, 3.0, 4.0},
            {2.0, 3.0, 2.0, 3.0}
        };
        CategoryDataset dataset = DatasetUtilities.createCategoryDataset(
"Region ", "Sales/Q", data);- 然后,对于JFreeChart对象也是不同的:ChartFactory.createMultiplePieChart()
JFreeChart chart = ChartFactory.createMultiplePieChart(
            "Multiple Pie Chart",  // chart title
            dataset,               // dataset
            TableOrder.BY_ROW,
            true,                  // include legend
            true,                  // include tooltips
            false                  // url?
);- 接着,对于plot对象也是不同的:MultiplePiePlot
MultiplePiePlot plot = (MultiplePiePlot) chart.getPlot();JFreeChart subchart = plot.getPieChart();
PiePlot p = (PiePlot) subchart.getPlot();


 1063
1063

 被折叠的 条评论
为什么被折叠?
被折叠的 条评论
为什么被折叠?
 到【灌水乐园】发言


