


在“并行堆栈”窗口中查看线程和任务(C#、Visual Basic 和 C++)View threads and tasks in the Parallel Stacks window (C#, Visual Basic, C++)
11/20/2018
本文内容
调试多线程应用程序时,“并行堆栈”窗口非常有用。The Parallel Stacks window is useful for debugging multithreaded applications. 它有多个视图:It has several views:
“线程”视图显示应用中所有线程的调用堆栈信息。Threads view shows call stack information for all threads in the app. 可以在线程和这些线程上的堆栈帧之间进行导航。You can navigate between threads and stack frames on those threads.
任务视图显示以任务为中心的调用堆栈信息。Tasks view shows task-centered call stack information.
In managed code, Tasks view shows call stacks of System.Threading.Tasks.Task objects.
方法视图以选定方法为中心显示调用堆栈。Method View pivots the call stack on a selected method.
使用“并行堆栈”窗口Use the Parallel Stacks window
只能在调试会话中打开“并行堆栈”窗口。To open the Parallel Stacks window, you must be in a debugging session. 选择“调试” > “窗口” > “并行堆栈” 。Select Debug > Windows > Parallel Stacks.
工具栏控件Toolbar controls
“并行堆栈”窗口具有以下工具栏控件:The Parallel Stacks window has the following toolbar controls:

图标Icon
控件Control
描述Description

线程/任务组合框Threads/Tasks combo box
在线程的调用堆栈和任务的调用堆栈之间切换视图。Switches the view between call stacks of threads and call stacks of tasks. 有关更多信息,请参见任务视图和线程视图。For more information, see Tasks view and Threads view.

仅显示已标记项Show Only Flagged
仅显示在其他调试器窗口(如“GPU 线程”窗口和“并行监视”窗口)中已标记的线程的调用堆栈 。Shows call stacks only for the threads that are flagged in other debugger windows, such as the GPU Threads window and the Parallel Watch window.

切换“方法视图”Toggle Method View
在调用堆栈视图和方法视图之间切换。Switches between call stack views and Method View. 有关更多信息,请参见方法视图。For more information, see Method View.

自动滚动到当前堆栈帧Auto Scroll To Current Stack Frame
自动滚动关系图,以便能够看到当前堆栈帧。Autoscrolls the graph so that the current stack frame is in view. 当从其他窗口更改当前堆栈帧或在大型关系图中命中新断点时,此功能非常有用。This feature is useful when you change the current stack frame from other windows, or when you hit a new breakpoint in large graphs.

切换缩放控件Toggle Zoom Control
显示或隐藏窗口左侧的缩放控件。Shows or hides the zoom control at the left of the window.
无论缩放控件是否可见,都可以通过按 Ctrl 并滚动鼠标滚轮来进行缩放,或者按 Ctrl+Shift++ 放大,按 Ctrl+Shift+- 缩小 。Regardless of the visibility of the zoom control, you can also zoom by pressing Ctrl and turning the mouse wheel, or by pressing Ctrl+Shift++ to zoom in and Ctrl+Shift+- to zoom out.
堆栈帧图标Stack Frame icons
以下图标提供有关所有视图中活动堆栈帧和当前堆栈帧的信息:The following icons provide information about the active and current stack frames in all views:
图标Icon
描述Description

指示当前线程的当前位置(活动堆栈帧)。Indicates the current location (active stack frame) of the current thread.

指示非当前线程的当前位置(活动堆栈帧)。Indicates the current location (active stack frame) of a non-current thread.

指示当前堆栈帧(当前调试器上下文)。Indicates the current stack frame (the current debugger context). 方法名称在任何地方都显示为粗体。The method name is bold wherever it appears.
上下文菜单项Context menu items
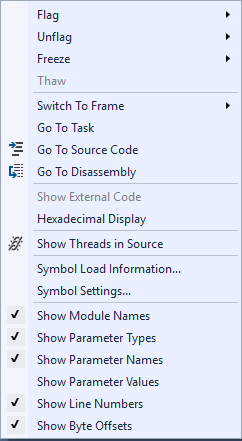
在“线程”视图或“任务”视图中右键单击方法时,可以看到以下快捷菜单项 。The following shortcut menu items are available when you right-click a method in Threads view or Tasks view. 最后六项与“调用堆栈”窗口中的相同。The last six items are the same as in the Call Stack window.
Menu itemMenu item
描述Description
标记Flag
标记选定项。Flags the selected item.
取消标记Unflag
取消标记选定项。Unflags the selected item.
冻结Freeze
冻结选定项。Freezes the selected item.
解冻Thaw
解冻选定项。Thaws the selected item.
切换到帧Switch To Frame
与“调用堆栈”窗口上的对应菜单命令相同。Same as the corresponding menu command in the Call Stack window. 但是在“并行堆栈”窗口中,一个方法可能位于多个帧中。However, in the Parallel Stacks window, one method may be in several frames. 可以在此项的子菜单中选择所需的帧。You can select the frame you want in the submenu for this item. 如果堆栈帧中有一个位于当前线程上,则子菜单中会默认选中该帧。If one of the stack frames is on the current thread, that frame is selected by default in the submenu.
“转到任务”或“转到线程”Go to Task or Go to Thread
切换到“任务”或“线程”视图,并突出显示相同的堆栈帧 。Switches to the Task or Threads view, and keeps the same stack frame highlighted.
转到源代码Go To Source Code
转到源代码窗口中的相应位置。Goes to the corresponding location in the source code window.
转到反汇编Go To Disassembly
转到“反汇编”窗口中的相应位置。Goes to the corresponding location in the Disassembly window.
显示外部代码Show External Code
显示或隐藏外部代码。Shows or hides external code.
十六进制显示Hexadecimal Display
在十进制和十六进制显示之间切换。Toggles between decimal and hexadecimal display.
在源中显示线程Show Threads in Source
标记线程在源代码窗口中的位置。Flags the location of the thread in the source code window.
符号加载信息Symbol Load Information
打开“符号加载信息”对话框。Opens the Symbol Load Information dialog box.
符号设置Symbol Settings
打开“符号设置”对话框。Opens the Symbol Settings dialog box.
线程视图Threads view
在“线程”视图中,当前线程的堆栈帧和调用路径突出显示为蓝色。In Threads view, the stack frame and call path of the current thread are highlighted in blue. 线程的当前位置由黄色箭头显示。The current location of the thread is shown by the yellow arrow.
若要更改当前堆栈帧,请双击其他方法。To change the current stack frame, double-click a different method. 这也可能会切换当前线程,具体取决于所选的方法属于当前线程还是其他线程。This might also switch the current thread, depending on whether the method you select is part of the current thread or another thread.
当“线程”视图关系图太大而无法放入窗口时,窗口中会出现“鸟瞰视图”控件 。When the Threads view graph is too large to fit into the window, a Bird's Eye View control appears in the window. 你可以在该控件中移动帧以导航到关系图的不同部分。You can move the frame in the control to navigate to different parts of the graph.
下图演示的是一个执行从主代码到托管代码再到本机代码的代码转换的线程。The following illustration shows one thread that goes from Main to a Managed to Native code transition. 当前方法中包含六个线程。Six threads are in the current method. 一个继续运行到 Thread.Sleep,另一个继续运行到 Console.WriteLine 再运行到 SyncTextWriter.WriteLine。One continues to Thread.Sleep, and another continues to Console.WriteLine and then to SyncTextWriter.WriteLine.
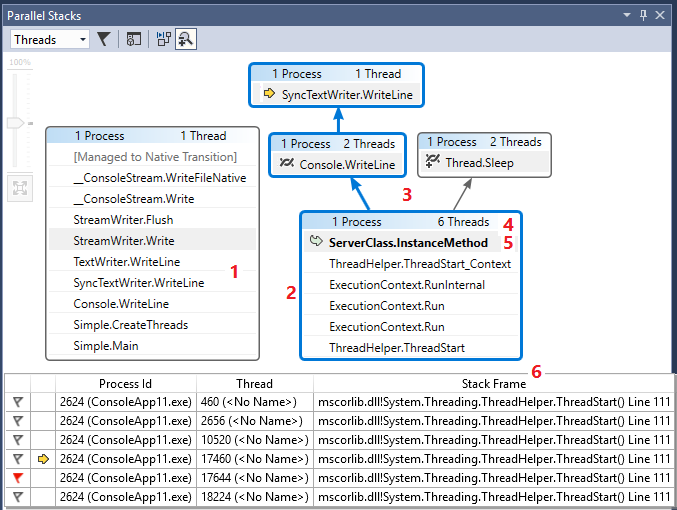
下表介绍“线程”视图的主要功能:The following table describes the main features of the Threads view:
标注Callout
元素名称Element name
说明Description
11
调用堆栈段或节点Call stack segment or node
包含一个或多个线程的一系列方法。Contains a series of methods for one or more threads. 如果该帧没有连接箭头线,则该帧显示线程的整个调用路径。If the frame has no arrow lines connected to it, the frame shows the entire call path for the thread(s).
22
蓝色突出显示Blue highlight
指示当前线程的调用路径。Indicates the call path of the current thread.
33
箭头线Arrow lines
连接节点,以组成线程的整个调用路径。Connect nodes to make up the entire call path for the thread(s).
44
节点标头Node header
显示节点的进程数和线程数。Shows the number of processes and threads for the node.
55
方法Method
表示同一方法中的一个或多个堆栈帧。Represents one or more stack frames in the same method.
66
方法上的工具提示Tooltip on method
在将鼠标悬停在方法上时显示。Appears when you hover over a method. 在“线程”视图中,工具提示会在类似“线程”窗口的表中显示所有线程 。In Threads view, the tooltip shows all threads, in a table similar to the Threads window.
任务视图Tasks view
如果应用使用 System.Threading.Tasks.Task 对象(托管代码)或 task_handle 对象(本机代码)来表示并行,则可以使用“任务”视图。If your app uses System.Threading.Tasks.Task objects (managed code) or task_handle objects (native code) to express parallelism, you can use Tasks view. “任务”视图显示任务(而不是线程)的调用堆栈。Tasks view shows call stacks of tasks instead of threads.
在“任务”视图中:In Tasks view:
不显示运行中任务以外的线程的调用堆栈。Call stacks of threads that aren't running tasks aren't shown.
身为运行中任务的线程,其调用堆栈的首尾将被隐藏,以显示与任务关系最密切的帧。Call stacks of threads that are running tasks are visually trimmed at the top and bottom, to show the most relevant frames for tasks.
当一个线程上有多个任务时,会在单独的节点中显示这些任务的调用堆栈。When several tasks are on one thread, the call stacks of those tasks are shown in separate nodes.
若要查看整个调用堆栈,请右键单击堆栈帧并选择“转到线程”以切换回“线程”视图 。To see an entire call stack, switch back to Threads view by right-clicking in a stack frame and selecting Go to Thread.
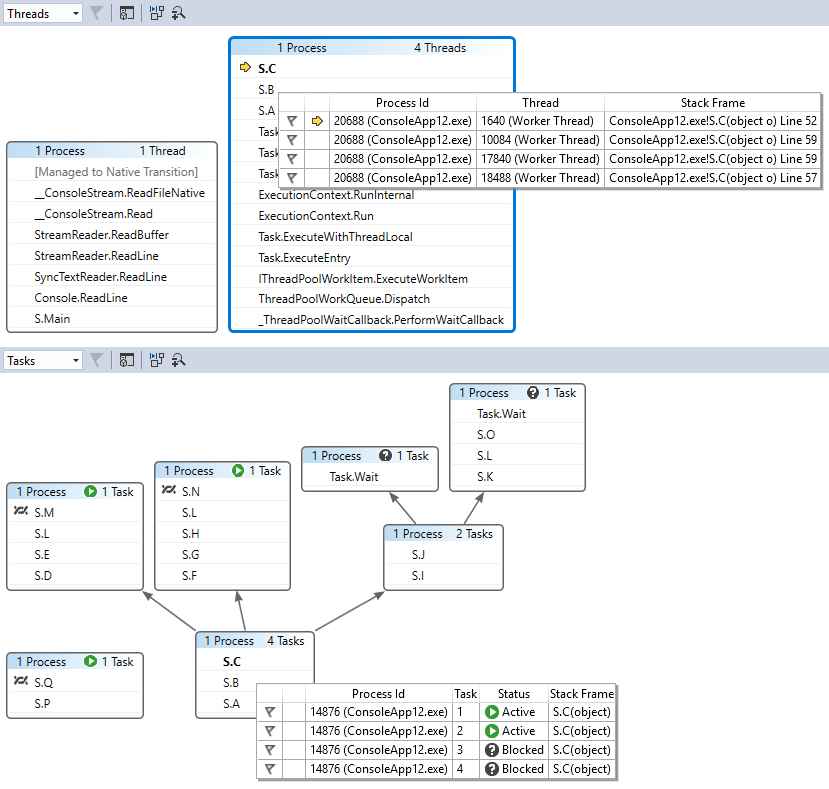
下图顶部显示的是“线程”视图,底部显示的是对应的“任务”视图 。The following illustration shows the Threads view at the top and the corresponding Tasks view at the bottom.

将鼠标悬停在方法上可显示带有额外信息的工具提示。Hover over a method to show a tooltip with additional information. 在“任务”视图中,工具提示会在类似于“任务”窗口的表中显示所有任务 。In Tasks view, the tooltip shows all the tasks in a table similar to the Tasks window.
下图顶部显示的是“线程”视图中的方法的工具提示,底部显示的是对应的“任务”视图的工具提示 。The following image shows the tooltip for a method in the Threads view at the top and for the corresponding Tasks view at the bottom.
方法视图Method View
在“线程”视图或“任务”视图中,可以通过选择工具栏上的“切换方法视图”图标,以当前方法为中心显示图形 。From either Threads view or Tasks view, you can pivot the graph on the current method by selecting the Toggle Method View icon on the toolbar. “方法视图”非常清晰地显示了调用当前方法或被当前方法调用的所有线程上的所有方法。Method View shows at a glance all methods on all threads that either call or are called by the current method. 下图在左侧和右侧分别显示了相同的信息在“线程”视图和“方法视图”中的显示情况 。The following illustration shows how the same information looks in Threads view on the left and in Method View on the right.

通过切换到新堆栈帧,可使该方法成为当前方法,并在“方法视图”中显示这个新方法的所有调用方和被调用方。If you switch to a new stack frame, you make that method the current method, and Method View shows all callers and callees for the new method. 这可能会导致某些线程显示在视图中或从视图中消失,具体取决于线程的调用堆栈上是否显示该方法。This may cause some threads to appear or disappear from the view, depending on whether that method appears on their call stacks. 若要返回调用堆栈视图,请再次选择“方法视图”工具栏图标。To return to the call stack view, select the Method View toolbar icon again.
请参阅See also


 912
912


 被折叠的 条评论
为什么被折叠?
被折叠的 条评论
为什么被折叠?
 到【灌水乐园】发言


