


GitHub地址:https://github.com/leebingbin/SpringCloud.MovieTicketing
一、为什么要实现微服务追踪
监控微服务的方式有很多,例如使用 Spring Boot Actuator 监控微服务实例,使用 Hystrix 监控 Hystrix Command 等。谈到微服务追踪,就不得不提一下 Peter Deutsch 的文章 The Eight Fallacies of Distributed Computing ( 分布式计算的八大误区 ) , 内容大致如下:
· 网络可靠
· 延迟为零
· 带宽无限
· 网络绝对安全
· 网络拓扑不会改变
· 必须有一名管理员
· 传输成本为零
· 网络同质化 (由 Java 之父 Golsing 补充)
不难可以看出,该文章很多点都在描述一个问题 —— 网络问题。网络常常很脆弱,同时, 网络资源也是有限的。
微服务之间通过网络进行通信。如果能够追踪每个请求,了解请求经过那些微服务 (从而了解信息是如何在服务之间流动),请求耗费时间、网络延迟、业务逻辑耗费时间等指标,那么就能更好地分析系统瓶颈、解决系统问题。因此,微服务追踪很有必要。
1.1 Spring Cloud Sleuth 简介
Spring Cloud Sleuth 为 Spring Cloud 提供了分布式追踪的解决方案,它大量借用了 Google Dapper 、Twitter Zipkin 和 Apache HTrace 的设计。
Sleuth 的术语:
· span(跨度):基本工作单元。span 用一个 64 位的 id 唯一标识。除了ID外,span 还包含其他数据,例如描述、时间戳事件、键值对的注解(标签),spanID、span父ID等。
· trace(追踪):一组共享“root span” 的 span 组成的树状结构称为 trace 。trace 也用一个 64 位的 ID 唯一标识,trace 中的所有 span 都共享该 trace 的ID 。
· annotation(标注): annotation 用来记录事件的存在,其中,核心 annotation 用来定义请求的开始和结束。
- CS ( Client Sent 客户端发送 ):客户端发起一个请求,该 annotation 描述了 span 的开始。
- SR ( Server Received 服务器端接收 ): 服务器端获得请求并准备处理它。如果用 SR 减去 CS 时间戳,就能得到网络延迟。
- SS ( Server Sent 服务器端发送 ):该 annotation 表明完成请求处理( 当响应发回客户端时 )。如果用 SS 减去 SR 时间戳,就能得到服务器端处理请求所需时间。
- CR( Client Received 客户端接收):span 结束标识。客户端成功接收到服务器端的响应。如果 CR 减去 CS 时间戳,就能得到从客户端发送请求到服务器响应的所需的时间。
二、整合 Spring Cloud Sleuth 与 ELK 配合使用
2.1 为项目添加依赖
# spring-cloud-starter-sleuth
# spring-cloud-starter-sleuth
<!-- https://mvnrepository.com/artifact/org.springframework.cloud/spring-cloud-starter-sleuth -->
<dependency>
    <groupId>org.springframework.cloud</groupId>
    <artifactId>spring-cloud-starter-sleuth</artifactId>
    <version>1.3.1.RELEASE</version>
</dependency>
# logback
# logback
<!-- https://mvnrepository.com/artifact/net.logstash.logback/logstash-logback-encoder -->
<dependency>
    <groupId>net.logstash.logback</groupId>
    <artifactId>logstash-logback-encoder</artifactId>
    <version>4.11</version>
</dependency>
2.2 新建 logback-spring.yml , 添加以下内容:
<?xml version="1.0" encoding="UTF-8"?>
<configuration>
<include resource="org/springframework/boot/logging/logback/defaults.xml" />
<springProperty scope="context" name="springAppName" source="spring.application.name" />
<!-- Example for logging into the build folder of your project -->
<property name="LOG_FILE" value="${BUILD_FOLDER:-build}/${springAppName}" />
<property name="CONSOLE_LOG_PATTERN"
value="%clr(%d{yyyy-MM-dd HH:mm:ss.SSS}){faint} %clr(${LOG_LEVEL_PATTERN:-%5p}) %clr([${springAppName:-},%X{X-B3-TraceId:-},%X{X-B3-SpanId:-},%X{X-B3-ParentSpanId:-},%X{X-Span-Export:-}]){yellow} %clr(${PID:- }){magenta} %clr(---){faint} %clr([%15.15t]){faint} %clr(%-40.40logger{39}){cyan} %clr(:){faint} %m%n${LOG_EXCEPTION_CONVERSION_WORD:-%wEx}" />
<!-- Appender to log to console -->
<appender name="console" class="ch.qos.logback.core.ConsoleAppender">
<filter class="ch.qos.logback.classic.filter.ThresholdFilter">
<!-- Minimum logging level to be presented in the console logs -->
<level>DEBUG</level>
</filter>
<encoder>
<pattern>${CONSOLE_LOG_PATTERN}</pattern>
<charset>utf8</charset>
</encoder>
</appender>
<!-- Appender to log to file -->
<appender name="flatfile" class="ch.qos.logback.core.rolling.RollingFileAppender">
<file>${LOG_FILE}</file>
<rollingPolicy class="ch.qos.logback.core.rolling.TimeBasedRollingPolicy">
<fileNamePattern>${LOG_FILE}.%d{yyyy-MM-dd}.gz</fileNamePattern>
<maxHistory>7</maxHistory>
</rollingPolicy>
<encoder>
<pattern>${CONSOLE_LOG_PATTERN}</pattern>
<charset>utf8</charset>
</encoder>
</appender>
<!-- Appender to log to file in a JSON format -->
<appender name="logstash" class="ch.qos.logback.core.rolling.RollingFileAppender">
<file>${LOG_FILE}.json</file>
<rollingPolicy class="ch.qos.logback.core.rolling.TimeBasedRollingPolicy">
<fileNamePattern>${LOG_FILE}.json.%d{yyyy-MM-dd}.gz</fileNamePattern>
<maxHistory>7</maxHistory>
</rollingPolicy>
<encoder class="net.logstash.logback.encoder.LoggingEventCompositeJsonEncoder">
<providers>
<timestamp>
<timeZone>UTC</timeZone>
</timestamp>
<pattern>
<pattern>
{
"severity": "%level",
"service": "${springAppName:-}",
"trace": "%X{X-B3-TraceId:-}",
"span": "%X{X-B3-SpanId:-}",
"parent": "%X{X-B3-ParentSpanId:-}",
"exportable": "%X{X-Span-Export:-}",
"pid": "${PID:-}",
"thread": "%thread",
"class": "%logger{40}",
"rest": "%message"
}
</pattern>
</pattern>
</providers>
</encoder>
</appender>
<root level="INFO">
<appender-ref ref="console" />
<appender-ref ref="logstash" />
<!--<appender-ref ref="flatfile"/> -->
</root>
</configuration>
2.3 ELK 搭建
ELK 的搭建比较简单,参考官方文档(或我的博客)即可:
http://www.elastic.co/guide/index.html
Docker 搭建 ELK:
http://elk-docker.readthedocs.io/
2.4 编写 Logstash 文件,命名为 logstash.conf
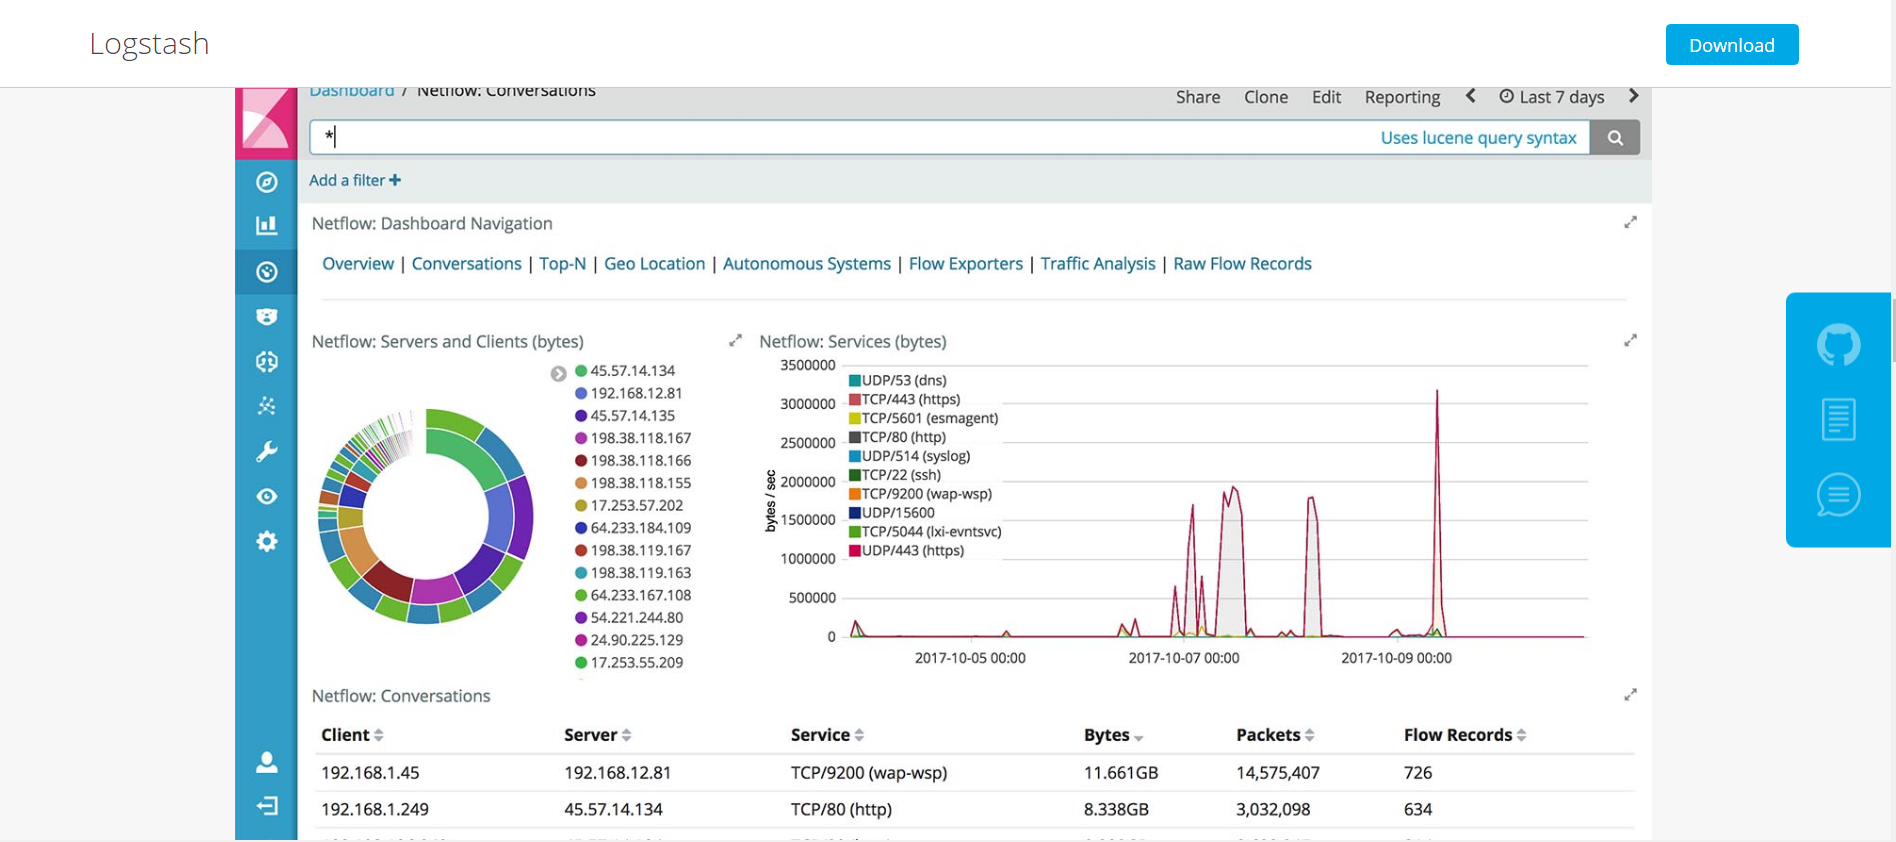
使用 logstash.conf 启动 Logstash 。Logstash是一款轻量级的日志搜集处理框架,可以方便的把分散的、多样化的日志搜集起来,并进行自定义的处理,然后传输到指定的位置,比如某个服务器或者文件。
官方参考:https://www.elastic.co/products/logstash
# logstash.conf

input {
	file {
		codec => json
		path => "/opt/build/*.json"		# 改成你项目打印的json日志文件
	}
}
filter {
	grok {
		math => { "message" => "%{TIMESTAMP_ISO08601:timestamp}\s+%{LOGLEVEL:
			severity}\s+\[%{DATA:service},%{DATA:trace},%{DATA:span},%{DATA:exportable}\]\s+%{DATA:pid}---\s+
			\[%{DATA:thread}\]\s+%{DATA:class}\s+:\s+%{GREEDYDATA:rest}" }
	}
}
output {
	elasticsearch {
		hosts => "elasticsearch:9222"	# 改成你的 Elasticsearch 地址
	}
}
三、Spring Cloud Sleuth 与 Zipkin 配合使用
1.1 Zipkin 简介
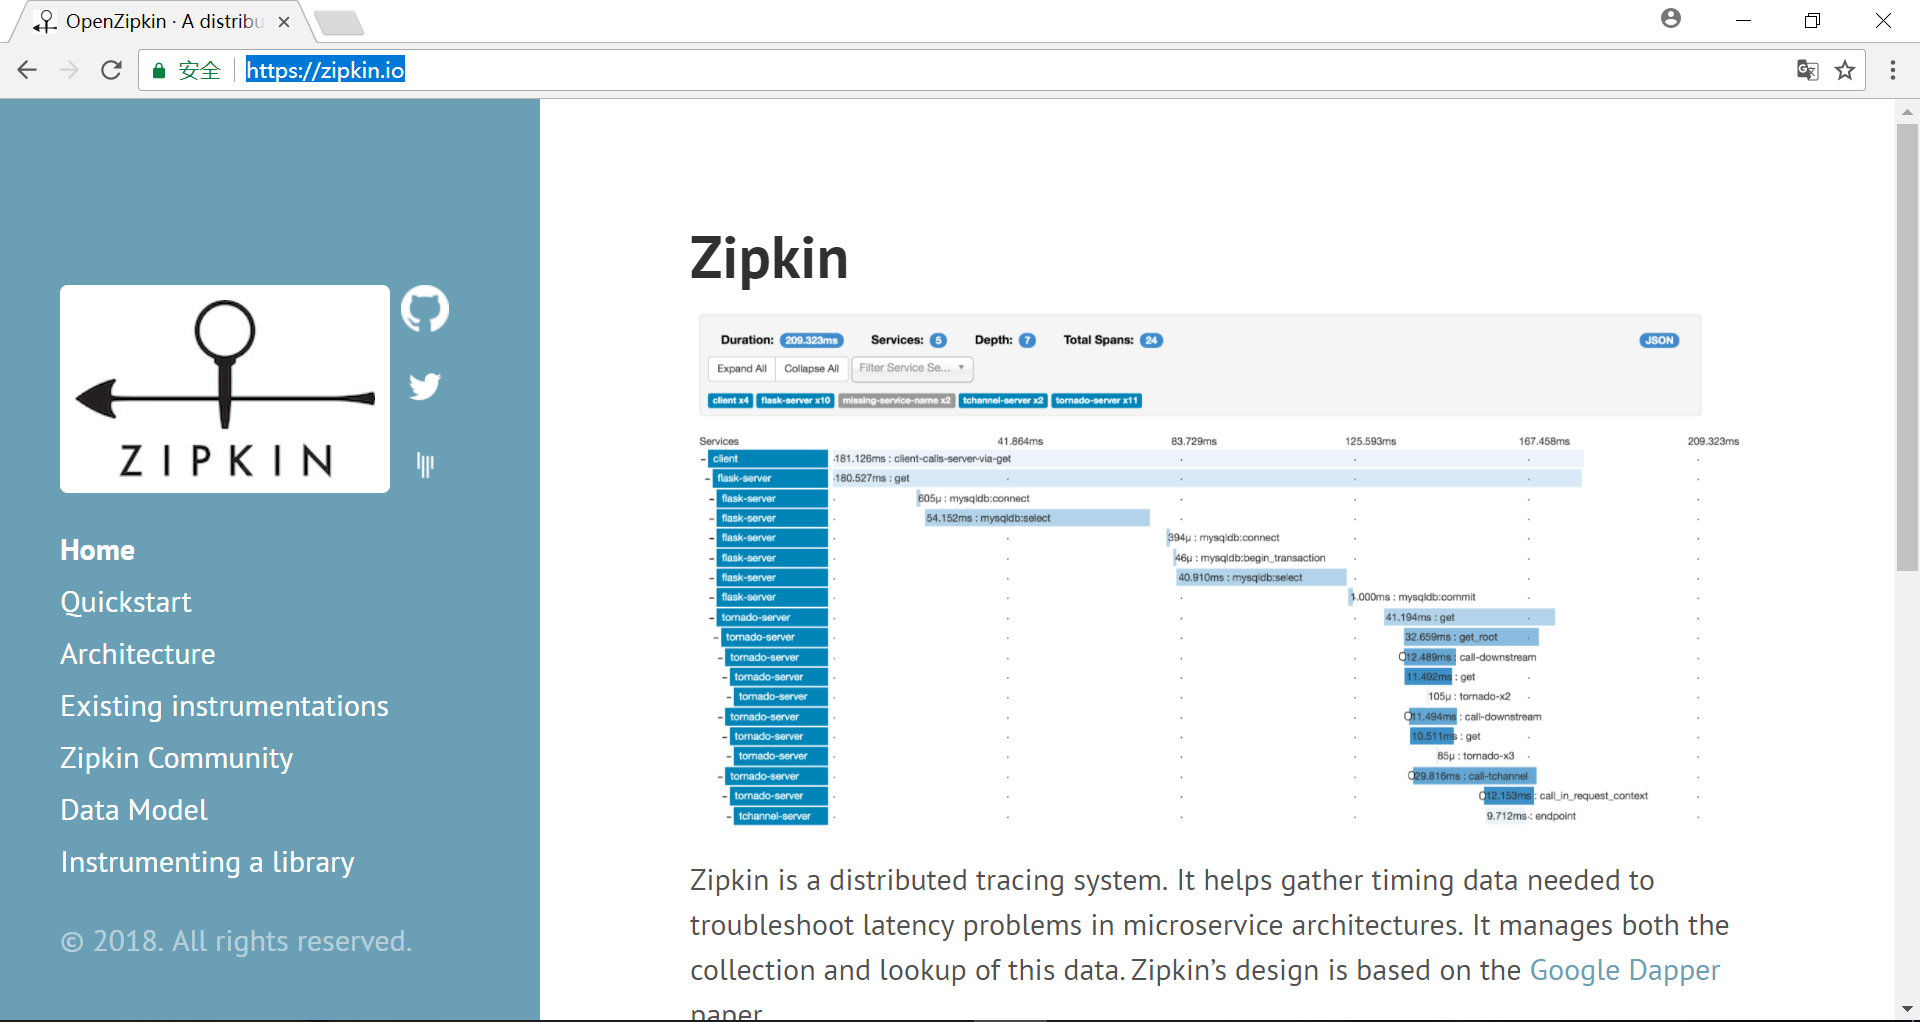
Zipkin 是 Twitter 开源的分布式跟踪系统,基于 Dapper 的论文设计而来。它的主要功能是收集系统的时序数据,从而追踪微服务架构的系统延时等问题。Zipkin 还提供了一个非常友好的界面,来帮助分析追踪数据。
1.2 Zipkin 官网
Zipkin 官方网站:https://zipkin.io/
1.3 引入依赖
  <dependencies>
    <dependency>
      <groupId>io.zipkin.java</groupId>
      <artifactId>zipkin-autoconfigure-ui</artifactId>
    </dependency>
    <dependency>
      <groupId>io.zipkin.java</groupId>
      <artifactId>zipkin-server</artifactId>
    </dependency>
  </dependencies>
1.4 编写启动类,使用 @EnableZipkinServer 注解,声明一个 Zipkin Server
import org.springframework.boot.SpringApplication;
import org.springframework.boot.autoconfigure.SpringBootApplication;

import zipkin.server.EnableZipkinServer;

@SpringBootApplication
@EnableZipkinServer
public class ZipkinServerApplication {
  public static void main(String[] args) {
    SpringApplication.run(ZipkinServerApplication.class, args);
  }
}
四、使用消息中间件收集数据
上面介绍的使用 HTTP 直接收集跟踪数据。相比 HTTP 的方式来说,使用消息中间件有以下优点:
· 微服务与 Zipkin Server 解耦,微服务无须知道 Zipkin Server 的网络地址。
· 一些场景下,Zipkin Server 与微服务网络可能不通,使用 HTTP 直接收集的方式无法工作,此时可借助消息中间件实现数据收集
1.1 添加依赖
首先,肯定要安装 RabbitMQ 作为消息中间件进行演示,RabbitMQ 的安装可以参考我的博客或者官方文档。
  <dependencies>
    <dependency>
      <groupId>org.springframework.cloud</groupId>
      <artifactId>spring-cloud-sleuth-zipkin-stream</artifactId>
    </dependency>
    <dependency>
      <groupId>org.springframework.cloud</groupId>
      <artifactId>spring-cloud-starter-sleuth</artifactId>
    </dependency>
    <dependency>
      <groupId>org.springframework.cloud</groupId>
      <artifactId>spring-cloud-stream-binder-rabbit</artifactId>
    </dependency>
    <dependency>
      <groupId>io.zipkin.java</groupId>
      <artifactId>zipkin-autoconfigure-ui</artifactId>
    </dependency>
  </dependencies>
1.2 修改启动类注解
修改启动类,将注解 @EnableZipkinServer 修改为 @EnableZipkinStreamServer 。然后修改配置文件 application.yml ,添加 rabbitmq 配置。
spring:
  rabbitmq:
    host: localhost
    port: 6666
    username: guest
    password: guest
五、存储追踪数据
按照上面的配置,Zipkin Server 是将数据存储在内存中。这种方式一般不适用于生产环境,因为一旦 Zipkin Server 重启或发生崩溃,就会导致历史数据的丢失。
Zipkin Server 支持多种后端存储,如 MySQL, Elasticsearch, Cassanda 等。在这块以如何将数据存储在 Elasticsearch 中,让其使用 RabbitMQ 收集跟踪数据并使用 Elasticsearch 作为后端存储。
1.1 添加依赖
 <dependencies>
    <dependency>
      <groupId>org.springframework.cloud</groupId>
      <artifactId>spring-cloud-sleuth-zipkin-stream</artifactId>
    </dependency>
    <dependency>
      <groupId>io.zipkin.java</groupId>
      <artifactId>zipkin-autoconfigure-ui</artifactId>
    </dependency>
    <dependency>
      <groupId>org.springframework.cloud</groupId>
      <artifactId>spring-cloud-stream-binder-rabbit</artifactId>
    </dependency>
    <dependency>
      <groupId>io.zipkin.java</groupId>
      <artifactId>zipkin-autoconfigure-storage-elasticsearch-http</artifactId>
      <version>1.16.2</version>
    </dependency>
  </dependencies>
1.2 修改配置文件 application.yml
zipkin:
  storage:
    type: elasticsearch
    elasticsearch:
      cluster: elasticsearch
      hosts: http://localhost:9200
      index: zipkin
      index-shards: 5
      index-replicas: 1
1.3 Elasticsearch 官网
Elasticsearch 官网:https://www.elastic.co/cn/
参考资料:
· 分布式计算的八大误区原文:https://blogs.oracle.com/jag/resource/Fallacies.html
· Zipkin 官方网站:https://zipkin.io/
· 消息队列-ActiveMQ:https://my.oschina.net/u/3375733/blog/890260
· RabbitMQ 官网 : https://www.rabbitmq.com/
· Elasticsearch 官方文档:https://www.elastic.co/guide/cn/elasticsearch/guide/current/index.html
· Elasticsearch 官网:https://www.elastic.co/cn/
· ELK 官方文档:https://www.elastic.co/guide/index.html
本文为博主原创文章,转载请注明出处!
https://my.oschina.net/u/3375733/blog/


 7288
7288

 被折叠的 条评论
为什么被折叠?
被折叠的 条评论
为什么被折叠?
 到【灌水乐园】发言


