


使用Spring Cloud Sleuth实现微服务跟踪
Spring Cloud版本:Hoxton.SR5
1. 简介
Spring Cloud Sleuth为Spring Cloud提供了分布式跟踪的解决方案,它大量借用了Google Dapper、Twitter Zipkin和Apache HTrace的设计。
Sleuth借用了Dapper的术语:
-
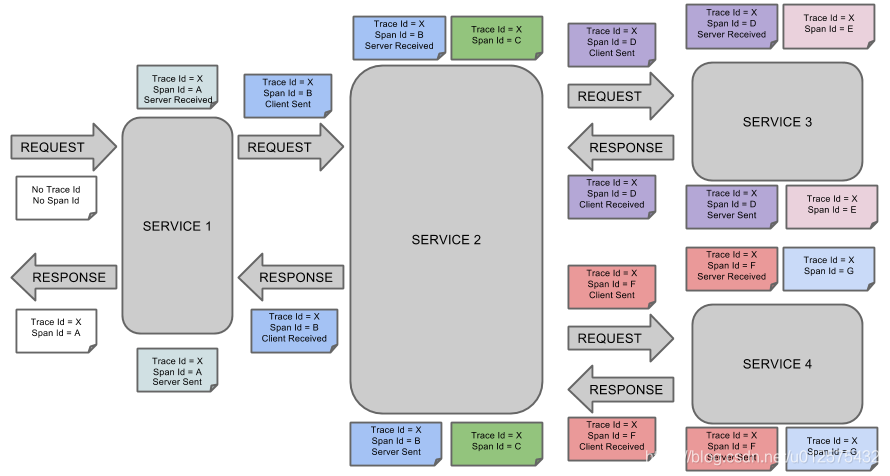
span(跨度):基本工作单元。span用一个64位的id唯一标识。除ID外,span还包含了其他数据,例如描述、时间戳事件、键值对的注解(标签),spanID、span父ID等。span被启动和停止时,记录了时间信息。初始化span被称为“root span”,该span的id和trace的ID相等。
-
trace(跟踪):一组共享“root span”的span组成的树状结构称为trace。trace也用一个64位的ID唯一标识,trace中的所有span都共享该trace的ID。
-
annotation(标注):annotaion用来记录事件的存在,其中,核心annotaion用来定义请求的开始和结束。
-
CS(Client Server客户端发送):客户端发起一个请求,该annotaion描述了span的开始
-
SR(Server Received服务器端接收):服务器端获得请求并准备处理它。如果用SR减去CS时间戳,就能得到网络延迟
-
SS(Server Sent服务器端发送):该annotation表明如果完成请求处理(当响应发挥客户端时)。如果用SS减去SR时间戳,就能得到服务器端处理请求所需的时间
-
CR(Client Received客户端接收):span结束的标识。客户端成功接收到服务器端的响应。如果CR减去CS时间戳,就能得到客户端发送请求到服务器响应所需的时间
-
2. 整合Spring Cloud Sleuth
-
在scl-eureka-client-consumer和scl-eureka-client-provider中添加如下依赖
<dependency> <groupId>org.springframework.cloud</groupId> <artifactId>spring-cloud-starter-sleuth</artifactId> </dependency> -
在配置文件application.yml中添加如下配置
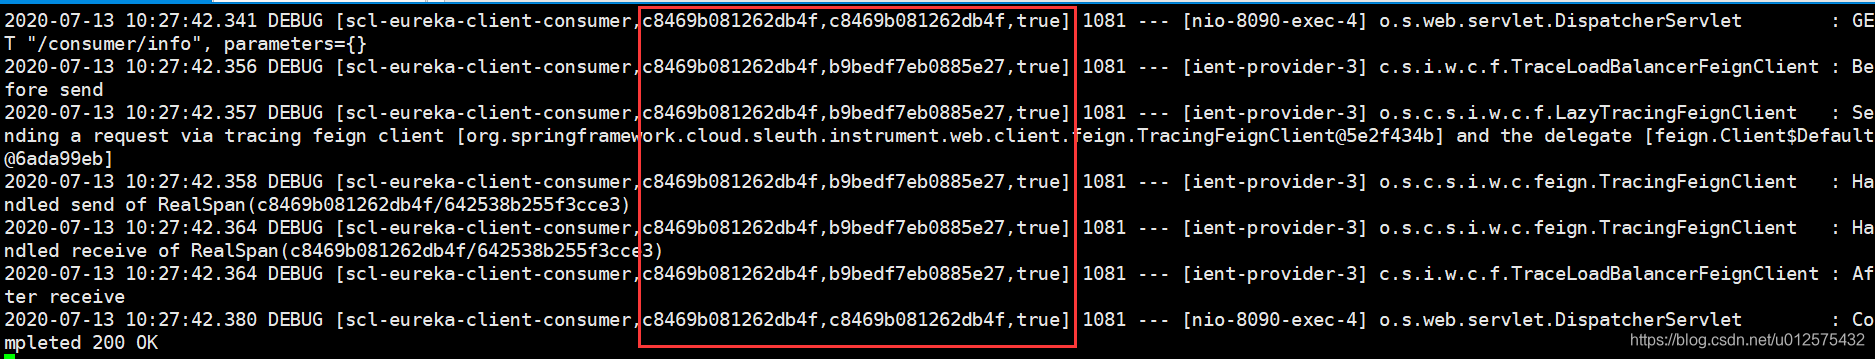
logging: level: root: INFO org.springframework.web.servlet.DispatcherServlet: DEBUG org.springframework.cloud.sleuth: DEBUG -
重启两个项目,访问http://localhost:8090/consumer/info,可发现两个项目的日志内容中已包含span和trace的一些信息
3. 整合ELK
ELK是一款非常流行的日志分析系统。搭建过程请参考:https://blog.csdn.net/u012575432/article/details/107252814
-
在scl-eureka-client-consumer和scl-eureka-client-provider中添加如下依赖
<dependency> <groupId>net.logstash.logback</groupId> <artifactId>logstash-logback-encoder</artifactId> <version>6.4</version> </dependency> -
因为日志需要输出给logstash进行分析,因此需要在
src/main/resources目录下新建文件logback-spring.xml,内容如下:<?xml version="1.0" encoding="UTF-8"?> <configuration> <include resource="org/springframework/boot/logging/logback/defaults.xml"/> <springProperty scope="context" name="springAppName" source="spring.application.name"/> <!-- Example for logging into the build folder of your project --> <property name="LOG_FILE" value=
 最低0.47元/天 解锁文章


 1232
1232


 被折叠的 条评论
为什么被折叠?
被折叠的 条评论
为什么被折叠?
 到【灌水乐园】发言


