


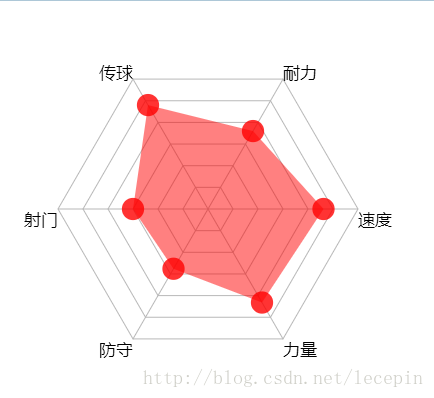
雷达图又叫蜘蛛网图,是一种对各项数据查看很明显的表现图,在很多游戏中,对游戏中的每个角色的分析图一般也用这种图。
下面,用HTML5的Cavas来实现雷达图。
效果
一、创建Canvas
var mW = 400;
var mH = 400;
var mCtx = null; var canvas = document.createElement('canvas'); document.body.appendChild(canvas); canvas.height = mH; canvas.width = mW; mCtx = canvas.getContext('2d'); - 1
- 2
- 3
- 4
- 5
- 6
- 7
- 8
- 9
- 10
- 1
- 2
- 3
- 4
- 5
- 6
- 7
- 8
- 9
- 10
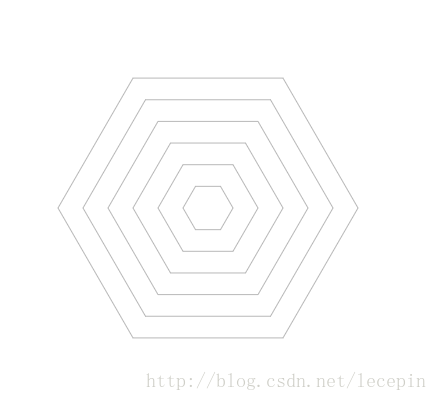
二、制作多边形背景
var mCount = 6; //边数
var mCenter = mW /2; //中心点 var mRadius = mCenter - 50; //半径(减去的值用于给绘制的文本留空间) var mAngle = Math.PI * 2 / mCount; //角度 var mColorPolygon = '#B8B8B8'; //多边形颜色 // 绘制多边形边 function drawPolygon(ctx){ ctx.save(); ctx.strokeStyle = mColorPolygon; var r = mRadius/ mCount; //单位半径 //画6个圈 for(var i = 0; i < mCount; i ++){ ctx.beginPath(); var currR = r * ( i + 1); //当前半径 //画6条边 for(var j = 0; j < mCount; j ++){ var x = mCenter + currR * Math.cos(mAngle * j); var y = mCenter + currR * Math.sin(mAngle * j); ctx.lineTo(x, y); } ctx.closePath() ctx.stroke(); } ctx.restore(); }- 1
- 2
- 3
- 4
- 5
- 6
- 7
- 8
- 9
- 10
- 11
- 12
- 13
- 14
- 15
- 16
- 17
- 18
- 19
- 20
- 21
- 22
- 23
- 24
- 25
- 26
- 27
- 28
- 29
- 1
- 2
- 3
- 4
- 5
- 6
- 7
- 8
- 9
- 10
- 11
- 12
- 13
- 14
- 15
- 16
- 17
- 18
- 19
- 20
- 21
- 22
- 23
- 24
- 25
- 26
- 27
- 28
- 29
效果:
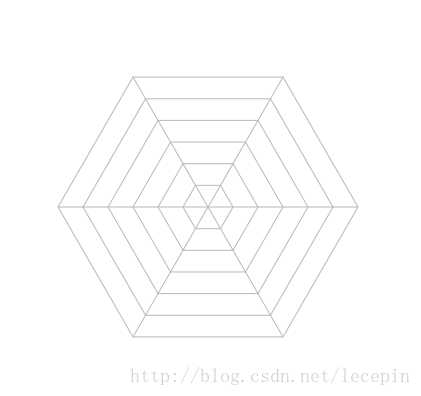
三、连接顶点线
var mColorLines = '#B8B8B8'; //顶点连线颜色

//顶点连线
function drawLines(ctx){ ctx.save(); ctx.beginPath(); ctx.strokeStyle = mColorLines; for(var i = 0; i < mCount; i ++){ var x = mCenter + mRadius * Math.cos(mAngle * i); var y = mCenter + mRadius * Math.sin(mAngle * i); ctx.moveTo(mCenter, mCenter); ctx.lineTo(x, y); } ctx.stroke(); ctx.restore(); }- 1
- 2
- 3
- 4
- 5
- 6
- 7
- 8
- 9
- 10
- 11
- 12
- 13
- 14
- 15
- 16
- 17
- 18
- 19
- 20
- 21
- 1
- 2
- 3
- 4
- 5
- 6
- 7
- 8
- 9
- 10
- 11
- 12
- 13
- 14
- 15
- 16
- 17
- 18
- 19
- 20
- 21
效果:
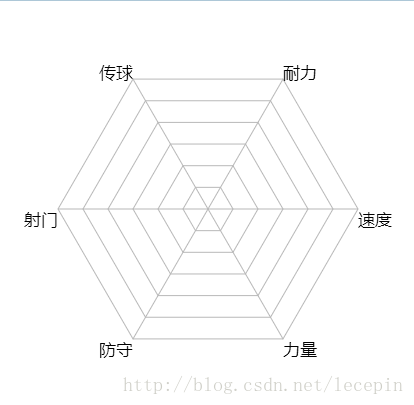
四、绘制数据文本
var mData = [['速度', 77],
['力量', 72], ['防守', 46], ['射门', 50], ['传球', 80], ['耐力', 60]]; //数据 var mColorText = '#000000'; //绘制文本 function drawText(ctx){ ctx.save(); var fontSize = mCenter / 12; ctx.font = fontSize + 'px Microsoft Yahei'; ctx.fillStyle = mColorText; for(var i = 0; i < mCount; i ++){ var x = mCenter + mRadius * Math.cos(mAngle * i); var y = mCenter + mRadius * Math.sin(mAngle * i); //通过不同的位置,调整文本的显示位置 if( mAngle * i >= 0 && mAngle * i <= Math.PI / 2 ){ ctx.fillText(mData[i][0], x, y + fontSize); }else if(mAngle * i > Math.PI / 2 && mAngle * i <= Math.PI){ ctx.fillText(mData[i][0], x - ctx.measureText(mData[i][0]).width, y + fontSize); }else if(mAngle * i > Math.PI && mAngle * i <= Math.PI * 3 / 2){ ctx.fillText(mData[i][0], x - ctx.measureText(mData[i][0]).width, y); }else{ ctx.fillText(mData[i][0], x, y); } } ctx.restore(); }- 1
- 2
- 3
- 4
- 5
- 6
- 7
- 8
- 9
- 10
- 11
- 12
- 13
- 14
- 15
- 16
- 17
- 18
- 19
- 20
- 21
- 22
- 23
- 24
- 25
- 26
- 27
- 28
- 29
- 30
- 31
- 32
- 33
- 34
- 35
- 1
- 2
- 3
- 4
- 5
- 6
- 7
- 8
- 9
- 10
- 11
- 12
- 13
- 14
- 15
- 16
- 17
- 18
- 19
- 20
- 21
- 22
- 23
- 24
- 25
- 26
- 27
- 28
- 29
- 30
- 31
- 32
- 33
- 34
- 35
效果:
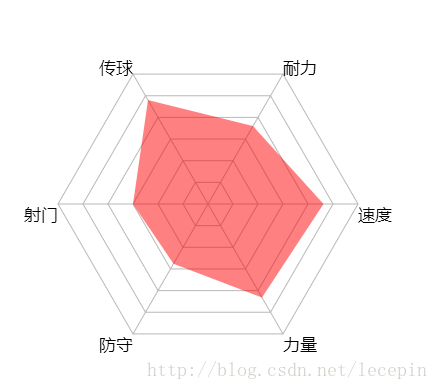
五、绘制数据覆盖区域
//绘制数据区域
function drawRegion(ctx){ ctx.save(); ctx.beginPath(); for(var i = 0; i < mCount; i ++){ var x = mCenter + mRadius * Math.cos(mAngle * i) * mData[i][1] / 100; var y = mCenter + mRadius * Math.sin(mAngle * i) * mData[i][1] / 100; ctx.lineTo(x, y); } ctx.closePath(); ctx.fillStyle = 'rgba(255, 0, 0, 0.5)'; ctx.fill(); ctx.restore(); }- 1
- 2
- 3
- 4
- 5
- 6
- 7
- 8
- 9
- 10
- 11
- 12
- 13
- 14
- 15
- 16
- 17
- 1
- 2
- 3
- 4
- 5
- 6
- 7
- 8
- 9
- 10
- 11
- 12
- 13
- 14
- 15
- 16
- 17
效果:
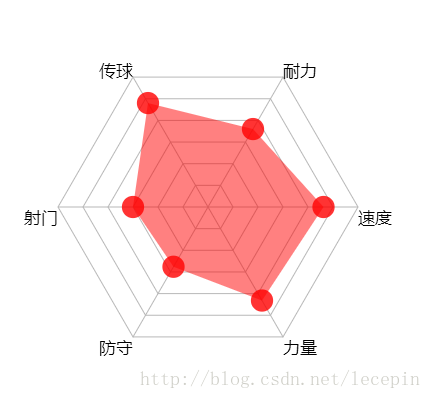
六、绘制数据点
把每个数据与线的焦点绘制出来。
//画点
function drawCircle(ctx){ ctx.save(); var r = mCenter / 18; for(var i = 0; i < mCount; i ++){ var x = mCenter + mRadius * Math.cos(mAngle * i) * mData[i][1] / 100; var y = mCenter + mRadius * Math.sin(mAngle * i) * mData[i][1] / 100; ctx.beginPath(); ctx.arc(x, y, r, 0, Math.PI * 2); ctx.fillStyle = 'rgba(255, 0, 0, 0.8)'; ctx.fill(); } ctx.restore(); }- 1
- 2
- 3
- 4
- 5
- 6
- 7
- 8
- 9
- 10
- 11
- 12
- 13
- 14
- 15
- 16
- 17
- 1
- 2
- 3
- 4
- 5
- 6
- 7
- 8
- 9
- 10
- 11
- 12
- 13
- 14
- 15
- 16
- 17
效果:
效果演示
最终代码
<!DOCTYPE html>
<html lang="en"> <head> <meta charset="UTF-8"> <title>Document</title> <style type="text/css"> canvas{ } </style> </head> <body> <script type="text/javascript"> var mW = 400; var mH = 400; var mData = [['速度', 77], ['力量', 72], ['防守', 46], ['射门', 50], ['传球', 80], ['耐力', 60]]; var mCount = mData.length; //边数 var mCenter = mW /2; //中心点 var mRadius = mCenter - 50; //半径(减去的值用于给绘制的文本留空间) var mAngle = Math.PI * 2 / mCount; //角度 var mCtx = null; var mColorPolygon = '#B8B8B8'; //多边形颜色 var mColorLines = '#B8B8B8'; //顶点连线颜色 var mColorText = '#000000'; //初始化 (function(){ var canvas = document.createElement('canvas'); document.body.appendChild(canvas); canvas.height = mH; canvas.width = mW; mCtx = canvas.getContext('2d'); drawPolygon(mCtx); drawLines(mCtx); drawText(mCtx); drawRegion(mCtx); drawCircle(mCtx); })(); // 绘制多边形边 function drawPolygon(ctx){ ctx.save(); ctx.strokeStyle = mColorPolygon; var r = mRadius/ mCount; //单位半径 //画6个圈 for(var i = 0; i < mCount; i ++){ ctx.beginPath(); var currR = r * ( i + 1); //当前半径 //画6条边 for(var j = 0; j < mCount; j ++){ var x = mCenter + currR * Math.cos(mAngle * j); var y = mCenter + currR * Math.sin(mAngle * j); ctx.lineTo(x, y); } ctx.closePath() ctx.stroke(); } ctx.restore(); } //顶点连线 function drawLines(ctx){ ctx.save(); ctx.beginPath(); ctx.strokeStyle = mColorLines; for(var i = 0; i < mCount; i ++){ var x = mCenter + mRadius * Math.cos(mAngle * i); var y = mCenter + mRadius * Math.sin(mAngle * i); ctx.moveTo(mCenter, mCenter); ctx.lineTo(x, y); } ctx.stroke(); ctx.restore(); } //绘制文本 function drawText(ctx){ ctx.save(); var fontSize = mCenter / 12; ctx.font = fontSize + 'px Microsoft Yahei'; ctx.fillStyle = mColorText; for(var i = 0; i < mCount; i ++){ var x = mCenter + mRadius * Math.cos(mAngle * i); var y = mCenter + mRadius * Math.sin(mAngle * i); if( mAngle * i >= 0 && mAngle * i <= Math.PI / 2 ){ ctx.fillText(mData[i][0], x, y + fontSize); }else if(mAngle * i > Math.PI / 2 && mAngle * i <= Math.PI){ ctx.fillText(mData[i][0], x - ctx.measureText(mData[i][0]).width, y + fontSize); }else if(mAngle * i > Math.PI && mAngle * i <= Math.PI * 3 / 2){ ctx.fillText(mData[i][0], x - ctx.measureText(mData[i][0]).width, y); }else{ ctx.fillText(mData[i][0], x, y); } } ctx.restore(); } //绘制数据区域 function drawRegion(ctx){ ctx.save(); ctx.beginPath(); for(var i = 0; i < mCount; i ++){ var x = mCenter + mRadius * Math.cos(mAngle * i) * mData[i][1] / 100; var y = mCenter + mRadius * Math.sin(mAngle * i) * mData[i][1] / 100; ctx.lineTo(x, y); } ctx.closePath(); ctx.fillStyle = 'rgba(255, 0, 0, 0.5)'; ctx.fill(); ctx.restore(); } //画点 function drawCircle(ctx){ ctx.save(); var r = mCenter / 18; for(var i = 0; i < mCount; i ++){ var x = mCenter + mRadius * Math.cos(mAngle * i) * mData[i][1] / 100; var y = mCenter + mRadius * Math.sin(mAngle * i) * mData[i][1] / 100; ctx.beginPath(); ctx.arc(x, y, r, 0, Math.PI * 2); ctx.fillStyle = 'rgba(255, 0, 0, 0.8)'; ctx.fill(); } ctx.restore(); } </script> </body> </html>- 1
- 2
- 3
- 4
- 5
- 6
- 7
- 8
- 9
- 10
- 11
- 12
- 13
- 14
- 15
- 16
- 17
- 18
- 19
- 20
- 21
- 22
- 23
- 24
- 25
- 26
- 27
- 28
- 29
- 30
- 31
- 32
- 33
- 34
- 35
- 36
- 37
- 38
- 39
- 40
- 41
- 42
- 43
- 44
- 45
- 46
- 47
- 48
- 49
- 50
- 51
- 52
- 53
- 54
- 55
- 56
- 57
- 58
- 59
- 60
- 61
- 62
- 63
- 64
- 65
- 66
- 67
- 68
- 69
- 70
- 71
- 72
- 73
- 74
- 75
- 76
- 77
- 78
- 79
- 80
- 81
- 82
- 83
- 84
- 85
- 86
- 87
- 88
- 89
- 90
- 91
- 92
- 93
- 94
- 95
- 96
- 97
- 98
- 99
- 100
- 101
- 102
- 103
- 104
- 105
- 106
- 107
- 108
- 109
- 110
- 111
- 112
- 113
- 114
- 115
- 116
- 117
- 118
- 119
- 120
- 121
- 122
- 123
- 124
- 125
- 126
- 127
- 128
- 129
- 130
- 131
- 132
- 133
- 134
- 135
- 136
- 137
- 138
- 139
- 140
- 141
- 142
- 143
- 144
- 145
- 146
- 147
- 148
- 149
- 150
- 151
- 152
- 153
- 154
- 1
- 2
- 3
- 4
- 5
- 6
- 7
- 8
- 9
- 10
- 11
- 12
- 13
- 14
- 15
- 16
- 17
- 18
- 19
- 20
- 21
- 22
- 23
- 24
- 25
- 26
- 27
- 28
- 29
- 30
- 31
- 32
- 33
- 34
- 35
- 36
- 37
- 38
- 39
- 40
- 41
- 42
- 43
- 44
- 45
- 46
- 47
- 48
- 49
- 50
- 51
- 52
- 53
- 54
- 55
- 56
- 57
- 58
- 59
- 60
- 61
- 62
- 63
- 64
- 65
- 66
- 67
- 68
- 69
- 70
- 71
- 72
- 73
- 74
- 75
- 76
- 77
- 78
- 79
- 80
- 81
- 82
- 83
- 84
- 85
- 86
- 87
- 88
- 89
- 90
- 91
- 92
- 93
- 94
- 95
- 96
- 97
- 98
- 99
- 100
- 101
- 102
- 103
- 104
- 105
- 106
- 107
- 108
- 109
- 110
- 111
- 112
- 113
- 114
- 115
- 116
- 117
- 118
- 119
- 120
- 121
- 122
- 123
- 124
- 125
- 126
- 127
- 128
- 129
- 130
- 131
- 132
- 133
- 134
- 135
- 136
- 137
- 138
- 139
- 140
- 141
- 142
- 143
- 144
- 145
- 146
- 147
- 148
- 149
- 150
- 151
- 152
- 153
- 154
代码下载:点击这里


 6675
6675

 被折叠的 条评论
为什么被折叠?
被折叠的 条评论
为什么被折叠?
 到【灌水乐园】发言


