


I've noticed more than once that some programmers are confused about the direction in which the stack grows on x86, and what "top of the stack" and "bottom of the stack" mean. It appears that this confusion is caused by a basic mismatch in the way people are used to thinking about stacks, and in the way the stack on x86 actually behaves [1].
In this article, I intend to resolve this confusion with a few helpful diagrams.
The stack analogy
Back to the basics. The stack analogy is sometimes demonstrated to new students of computing with a stack of plates. You push a plate onto the stack and pop a plate off the stack. The top of the stack is where your next plate goes when pushing, and from where you take a plate when popping.

Hardware stacks
In computers, the stack is usually a specially treated region of memory. In the abstract sense, the analogy applies - you push data by placing it on the top of the stack, and pop data by taking it from the top of the stack. Note that this doesn't address the issue of where the top of the stack is located in memory.
The stack in x86
Herein lies the source of the confusion. Intel's x86 architecture places its stack "head down". It starts at some address and grows down to a lower address. Here's how it looks:
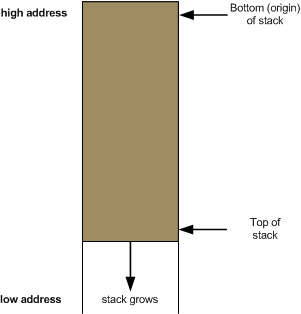
So when we say "top of the stack" on x86, we actually mean the lowest address in the memory area occupied by the stack. This may be unnatural for some people [2]. As long as we keep the diagram shown above firmly in mind, however, we should be OK.
While we're at it, let's see how some common idioms of x86 assembly programming map to this graphical representation.
Pushing and popping data with the stack pointer
The x86 architecture reserves a special register for working with the stack - ESP (Extended Stack Pointer). The ESP, by definition, always points to the top of the stack:
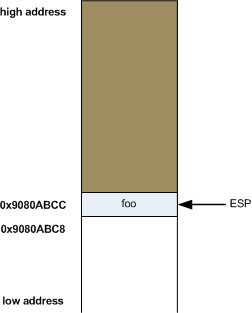
In this diagram, address 0x9080ABCC is the top of the stack. The word located in it is some "foo" and ESP contains the address 0x9080ABCC - in other words, points to it.
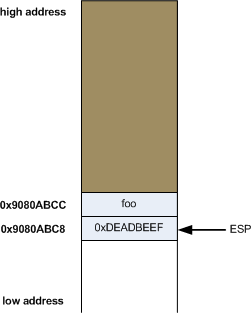
To push new data onto the stack we use the push instruction [3]. What push does is first decrement espby 4, and then store its operand in the location esp points to. So this:
push eax
Is actually equivalent to this:
sub esp, 4
mov [esp], eax
Taking the previous diagram as the starting point, and supposing that eax held the venerable value0xDEADBEEF, after the push the stack will look as follows:
Similarly, the pop instruction takes a value off the top of stack and places it in its operand, increasing the stack pointer afterwards. In other words, this:
pop eax
Is equivalent to this:
mov eax, [esp]
add esp, 4
So, again, taking the previous diagram (after the push) as a starting point, pop eax will do the following:
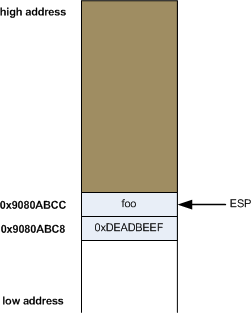
And the value 0xDEADBEEF will be written into eax. Note that 0xDEADBEEF also stays at address0x9080ABC8, since we did nothing to overwrite it yet.
Stack frames and calling conventions
When looking at assembly code generated from C, you will find a lot of interesting patterns. Perhaps the most recognizable pattern is the way parameters are passed into functions using the stack, and the way local variables are allocated on the stack [4].
I'll demonstrate this with a simple C program:
int foobar(int a, int b, int c)
{
    int xx = a + 2;
    int yy = b + 3;
    int zz = c + 4;
    int sum = xx + yy + zz;

    return xx * yy * zz + sum;
}

int main()
{
    return foobar(77, 88, 99);
}
Both the arguments passed into foobar and the local variables of that function, along with some other data, are going to be stored on the stack when foobar is called. This set of data on the stack is called a frame for this function. Right before the return statement, the stack frame for foobar looks like this:
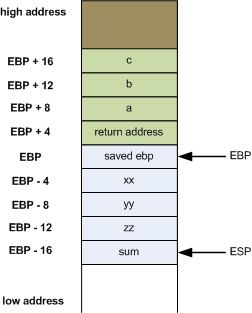
The green data were pushed onto the stack by the calling function, and the blue ones by foobar itself.
Compiled with gcc into assembly as follows:
gcc -masm=intel -S z.c -o z.s
The following assembly listing is generated for foobar. I commented it heavily for easy understanding:
_foobar:
    ; ebp must be preserved across calls. Since
    ; this function modifies it, it must be
    ; saved.
    ;
    push    ebp

    ; From now on, ebp points to the current stack
    ; frame of the function
    ;
    mov     ebp, esp

    ; Make space on the stack for local variables
    ;
    sub     esp, 16

    ; eax <-- a. eax += 2. then store eax in xx
    ;
    mov     eax, DWORD PTR [ebp+8]
    add     eax, 2
    mov     DWORD PTR [ebp-4], eax

    ; eax <-- b. eax += 3. then store eax in yy
    ;
    mov     eax, DWORD PTR [ebp+12]
    add     eax, 3
    mov     DWORD PTR [ebp-8], eax

    ; eax <-- c. eax += 4. then store eax in zz
    ;
    mov     eax, DWORD PTR [ebp+16]
    add     eax, 4
    mov     DWORD PTR [ebp-12], eax

    ; add xx + yy + zz and store it in sum
    ;
    mov     eax, DWORD PTR [ebp-8]
    mov     edx, DWORD PTR [ebp-4]
    lea     eax, [edx+eax]
    add     eax, DWORD PTR [ebp-12]
    mov     DWORD PTR [ebp-16], eax

    ; Compute final result into eax, which
    ; stays there until return
    ;
    mov     eax, DWORD PTR [ebp-4]
    imul    eax, DWORD PTR [ebp-8]
    imul    eax, DWORD PTR [ebp-12]
    add     eax, DWORD PTR [ebp-16]

    ; The leave instruction here is equivalent to:
    ;
    ;   mov esp, ebp
    ;   pop ebp
    ;
    ; Which cleans the allocated locals and restores
    ; ebp.
    ;
    leave
    ret
Since esp keeps moving as the function executes, ebp (base pointer, also known as frame pointer in other architectures) is used as a convenient anchor relatively to which all function arguments and locals can be found. Arguments are above ebp in the stack (hence the positive offset when accessing them), while locals are below ebp in the stack.

| [1] | It doesn't help that some online resources mistakenly call the top of the stack "bottom". The version presented here is the correct one of x86, since it relies on terminology defined in Intel's x86 architecture manuals. |
| [2] | You may try to fix the confusion by viewing memory with its low addresses at the top and high addresses at the bottom. While this would indeed make stack movement more natural, it would also mean that increasing some memory address would take it down in the graphical representation, which is probably even more counter-intuitive. |
| [3] | There are several instructions x86 defines in the "push family". I'm demonstrating push since it's the simplest and most generally applicable. |
| [4] | This only applies to some calling conventions and architectures, of course. In others, some parameters are passed in registers. |


 408
408


 被折叠的 条评论
为什么被折叠?
被折叠的 条评论
为什么被折叠?
 到【灌水乐园】发言


