


我们的项目中有关于数据仓库和挖掘,用户要求UI的界面需要仪表盘,我网上找了下,没有发现免费的HTML仪表盘,饼图啥图表的确很多,那就没有办法了,我和同事自己做了一个仪表盘,结果如下。
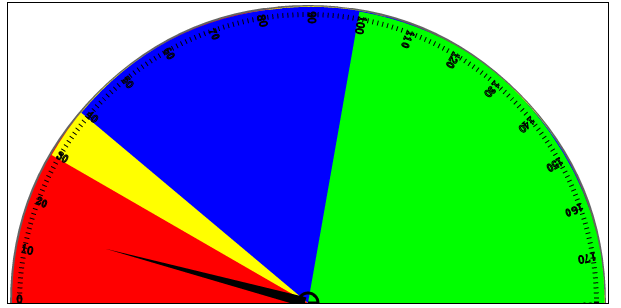
之后我们就来讨论下这个简单的仪表盘是怎么做的。我们先大致有一个想法,设定一个宽高2:1的canvas,仪表盘的半径就是canvas的高度,仪表盘需要的数据有上面分几个区域(一般是低中高三个区域,为了测试我们准备了四个区域),刻度线和文字,指针,和指针指向的值。
首先第一步自然是canvas的声明
- [html] view plaincopy
- <body>
- <div>
- <canvas id="board" width="800" height="600">
- </canvas>
- </div>
- </body>
- </html>
之后的工作都在javascript中完成,我们需要定义一些对象
- [javascript] view plaincopy
- //仪表盘面板
- var panel = function(id, option) {
- this.canvas = document.getElementById(id); //获取canvas元素
- thisthis.cvs = this.canvas.getContext("2d"); //得到绘制上下文
- thisthis.width = this.canvas.width; //对象宽度
- thisthis.height = this.canvas.height; //对象高度
- this.level = option.level;
- this.outsideStyle = option.outsideStyle;
- }
这个panel就是我们的仪表盘对象,参数的id是canvas元素,option是我们需要提交给仪表盘的一些参数值。这个option的定义如下:option对象可以扩展,你可以通过optin定制更加自由强大的仪表盘对象的。
- [javascript] view plaincopy
- var panelOption = {
- maxLength: 30,
- interval: 5,
- level: [//仪表盘需要呈现的数据隔离区域
- {start: 0, color: "red" },
- { start: 30, color: "yellow" },
- { start: 40, color: "blue" },
- { start: 100, color: "Lime" }
- ],
- outsideStyle: { lineWidth: 4, color: "rgba(100,100,100,1)" }
- };
在绘制元素的时候,我们常常需要保存和恢复现场,特别当我们使用转移,旋转等方法的时候,一定要记得先save最后restore。为了方便,我们编写了一个save函数提供这个方式,这个模式类似C#中的委托,和设计模式中的观察着模式
- [javascript] view plaincopy
- panel.prototype.save = function(fn) {
- this.cvs.save();
- fn();
- this.cvs.restore();
- }
上面这个save可以方便的帮助我们保存和回复现场。
我们定义个用于画半圆的方法,这个方法中,我们将需要画半圆时做的translate放到save函数中,这样画半圆的变形操作不会对其他操作有影响。
- [javascript] view plaincopy
- panel.prototype.drawArc = function() {
- var p = this;
- var cvs = this.cvs;
- p.save(function() {
- cvs.translate(p.width / 2, p.height); //将坐标点移到矩形的底部的中间
- cvs.beginPath();
- cvs.lineWidth = p.outsideStyle.lineWidth;
- cvs.strokeStyle = p.outsideStyle.color;
- cvs.arc(0, 0, p.height - cvs.lineWidth, 0, Math.PI / 180 * 180, true); //画半圆
- cvs.stroke();
- });
- }
然后我们绘制中间颜色的填充区域
- [javascript] view plaincopy
- panel.prototype.drawLevelArea = function(level) {
- var p = this;
- var cvs = this.cvs;
- for (var i = 0; i < level.length; i++) {
- p.save(function() {
- cvs.translate(p.width / 2, p.height);
- cvs.rotate(Math.PI / 180 * level[i].start);
- p.save(function() {
- cvs.beginPath();
- cvs.arc(0, 0, p.height - p.outsideStyle.lineWidth, Math.PI / 180 * 180, Math.PI / 180 * 360);
- cvs.fillStyle = level[i].color;
- cvs.fill();
- });
- });
- }
- }
上面的代码中,rotate很重要,我们每次都按level中的值进行旋转,然后画180°的颜色。这样的过程是
第一次旋转是0,没有动,用红色画了180°的半圆
第二次旋转了30°,你可以想想目前的画布放斜了,然后以斜的画了180°黄,这样恰恰好吧红色超过30°的颜色都覆盖了
依次类推,我们不要对arc的起始和结束值做改变,我们只要再画之前,rotate就可以了。当然,要放在save中哦。
之后是画线,道理是一样的,代码如下
- [javascript] view plaincopy
- panel.prototype.drawLine = function() {
- var p = this;
- var cvs = this.cvs;
- for (var i = 0; i <= 180; i++) {
- p.save(function() {
- cvs.translate(p.width / 2, p.height);
- cvs.rotate(Math.PI / 180 * i);
- p.save(function() {
- cvs.beginPath();
- cvs.lineTo(-(p.height - p.outsideStyle.lineWidth) + 10, 0);
- cvs.lineTo(-(p.height - p.outsideStyle.lineWidth) + 5, 0);
- cvs.stroke();
- if (i % 10 == 0) {
- p.drawText(i);
- }
- });
- });
- }
- }
不过下面画文字的代码我没有优化,你可以自己按上面的方式旋转下
- [javascript] view plaincopy
- panel.prototype.drawText = function(val) {
- var p = this;
- var cvs = this.cvs;
- p.save(function() {
- cvs.lineWidth = 1;
- cvs.strokeText(val, -(p.height - p.outsideStyle.lineWidth) + 5, 0);
- });
- }
最后是画指针,指针的角度值,是通过我们给的value来计算的。
- [javascript] view plaincopy
- panel.prototype.drawSpanner = function(value) {
- var p = this;
- var cvs = this.cvs;
- p.save(function() {
- cvs.translate(p.width / 2, p.height);
- cvs.moveTo(0, 0);
- cvs.arc(0, 0, p.height / 30, 0, (Math.PI / 180) * 360);
- cvs.lineWidth = 3;
- cvs.stroke();
- });
- p.save(function() {
- cvs.translate(p.width / 2, p.height);
- cvs.rotate(Math.PI / 180 * -90);
- p.save(function() {
- cvs.rotate(Math.PI / 180 * value);
- cvs.beginPath();
- cvs.moveTo(5, -3);
- cvs.lineTo(0, -p.height * 0.7);
- cvs.lineTo(-5, -3);
- cvs.lineTo(5, -3);
- cvs.fill();
- });
- });
- }
现在主要的方法都完成了,我们实现对用户的接口
- [javascript] view plaincopy
- panel.prototype.init = function(value) {
- var p = this;
- var cvs = this.cvs;
- cvs.clearRect(0, 0, this.width, this.height);
- p.drawArc();
- p.drawLevelArea(p.level);
- p.drawLine();
- p.drawSpanner(value);
- }
到此,panel的对象我们都编写完成,以下是如何调用
- [javascript] view plaincopy
- window.onload = function() {
- var panelOption = {
- maxLength: 30,
- interval: 5,
- level: [//仪表盘需要呈现的数据隔离区域
- {start: 0, color: "red" },
- { start: 30, color: "yellow" },
- { start: 40, color: "blue" },
- { start: 100, color: "Lime" }
- ],
- outsideStyle: { lineWidth: 4, color: "rgba(100,100,100,1)" }
- };
- Panel = new panel("board", panelOption);
- Panel.init(15);
- }
大家可以测试这个简单的仪表盘了
转载于:https://blog.51cto.com/shyleoking/863987


 420
420


 被折叠的 条评论
为什么被折叠?
被折叠的 条评论
为什么被折叠?
 到【灌水乐园】发言


