


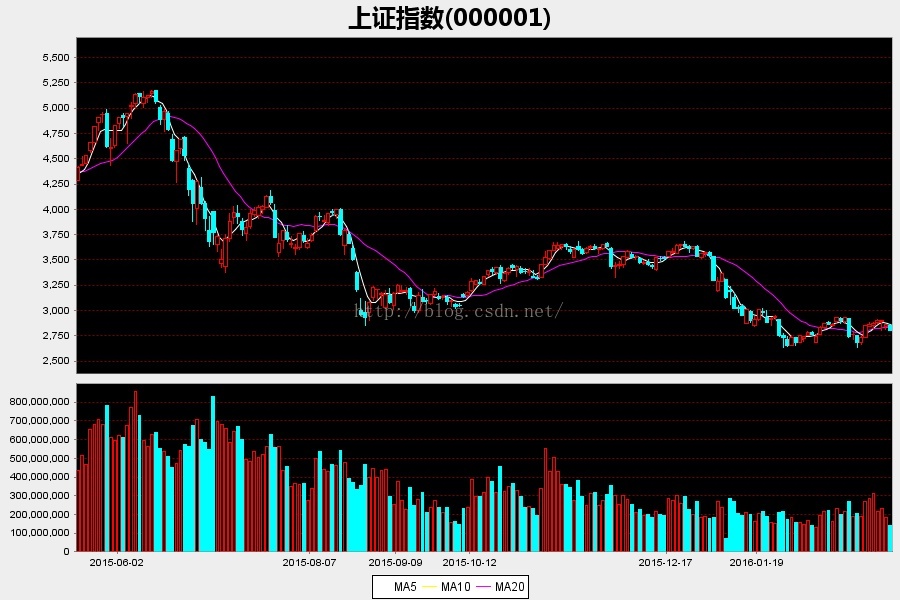
首先,k线图里包含了蜡烛图、折线图、柱状图,上面图例。然后,折线图和蜡烛图画在了一个plot里面。柱状图单独一个plot。
先说说蜡烛图。JFreeCharts里专门提供了一个叫OHLCSeries(open、high、low、close)的类来存放蜡烛图数据。构造方法直接指定时间,然后指定OHLC数据就完成了数据构建。数据完成了,然后开始让图变得美观。通过CandlestickRenderer(蜡烛图画图器)来设置股票涨时的颜色(红)和跌时的颜色(青),画图器有专门的方法提供setUp(Down)Paint。然后还能分别指定你的series颜色,setSeriesPaint(int index, Paint paint),这里如果设置了up(down)paint,这个设置就只会改变外框的颜色(要的就是这个效果)。然后就完成了国内股票市场展示的通用颜色。
均线也是一个道理,设置方法基本差不多。在这里,均线和k线放在一起。要实现这个效果其实很简单。在我们new plot对象时,先不要给对象设置数据和画图器,因为蜡烛图和均线图使用的series不是同一个(均线使用的是TimeSeries),所以new plot对象时如果设置了数据,则plot会默认数据格式为OHLCSeries(猜的),然后在设置进TimeSeries的数据时就会出现数据转换异常。解决的方法就是先不设置,然后初始化好对象后,调用plot.setDateset(int index, SeriesCollection series),然后调用plot.setRenderer来指定画图器即可。这样,两个数据线就叠加到了一个plot里。
柱状图数据省略掉了噢。数据说完,然后说说轴线问题,先说x轴(时间轴)。首先,x轴会自动生成,但是很多时候自动生成的往往不符合我们的需求,所以先.setAutoTickUnitSelection(false);//设置不采用自动选择刻度值。关闭自动设置,然后关闭自动设置范围,setAutoRange(false)。关闭完成后,需要设置的地方其实不多,先设置时间范围setRange(startDate, endDate)、然后设置时间格式setDateFormatOverrride、设置时间刻度间隔setTickUnit(new DateTickUnit(DateTickUnit.DAY, 1)、然后还可以设置时间显示规则,例如去掉周六、周日这种节假日SegmentedTimeline timeline = SegmentedTimeline.newMondayThroughFridayTimeline();.setTimeline(timeline);如果还想排除一些特殊日子,可以用timeline.addException(date)。这样,x轴的设置就完成了。然后是y轴,y轴这里没有什么特殊要求,直接先取消自动设置范围setAutoRange(false),然后设置一个数据范围就行了,setRange(low, high)。
最后将两个Plot结合到一个画板里。使用CombinedDomainXYPlot这个类来操作即可,调用add(Plot plot, int weight)//添加图形区域对象,后面的数字是计算这个区域对象应该占据多大的区域2/3。这个类没多少要设置的,这里我就不一一讲解了。最后生成Chart,通过ChartUtilities.saveChartAsJPEG存放到指定路径就ok了。
public String stockKChart(Map<String, String>
 params) {

String data = null;

//获取数据

if("index".equalsIgnoreCase(params.get("type"))){//指数

data = dataService.getIndexKData(params);

} else if("stock".equalsIgnoreCase(params.get("type"))){//股票

data = dataService.getaStockKData(params);

}

params.put("data", data);

logger.info("stockKChart : params : " + params);

logger.info("stockKChart : data : " + data);

String path = null;
//绘画图片

if(StringUtils.isBlank(params.get("isAverage"))&&StringUtils.isBlank(params.get("isTradVol")))
{

path = kChartPlant(params);

} else if(StringUtils.isBlank(params.get("isAverage")) && StringUtils.isNotBlank(params.get("isTradVol"))){

path = kBarChartPlant(params);

} else if(StringUtils.isNotBlank(params.get("isAverage")) && StringUtils.isNotBlank(params.get("isTradVol"))){

path = kBarLineChartPlant(params);

}

//返回图片存放路径

return path;

}
数据模型:
/**

* 获取指数据日K线数据

*/

public String getIndexKData(Map<String,String> params){

String secucode = (String)params.get("secucode");

String startDate = (String)params.get("startDate");

String endDate = (String)params.get("endDate");

String isAverage = (String)params.get("isAverage");//判断是否需要均线

String isTradVol = (String)params.get("isTradVol");//判断是否需要日交易量

String type = (String)params.get("type");


if(secucode.indexOf(".") > 0 ) secucode = secucode.substring(0 , secucode.indexOf(".")); //如果代码中包括:.sh、.sz时,取出正式的代码


List<Map> dataList = jydbDataServiceImpl.getAIndexOrStockKData(secucode,false, startDate, endDate, type);

if("1".equalsIgnoreCase(isAverage)){
jydbDataServiceImpl.initAverage(secucode ,false ,type);

}

Map map = new HashMap();

List quoteList = new ArrayList();//封装日行情数据

List tradVol = new ArrayList();//封装日交易量数据

List average5 = new ArrayList();//五日均线数据

List average20 = new ArrayList();//十日均线数据

String secuabbr = null;

// System.out.println("dataList is :"+dataList);

for(Map data : dataList){

if(secuabbr == null) {

secuabbr = (String)data.get("secuabbr");

if(secuabbr.startsWith("申万")){

secuabbr = secuabbr.substring(2);

}

}

List dayQuote = new ArrayList();//日K线数据

List dayTradVol = new ArrayList();//日成交量数据

Date tradingDay = (Date)data.get("tradingday");

Double openPrice = (Double)data.get("openprice");

Double highprice = (Double)data.get("highprice");

Double lowprice = (Double)data.get("lowprice");

Double closeprice = (Double)data.get("closeprice");

Double turnovervolume = (Double)data.get("turnovervolume");

dayQuote.add(DateFormatUtils.getDate12(tradingDay));

dayQuote.add(openPrice);

dayQuote.add(closeprice);

dayQuote.add(highprice);

dayQuote.add(lowprice);

quoteList.add(dayQuote);
//添加成交量数据

if("1".equalsIgnoreCase(isTradVol)){

dayTradVol.add(DateFormatUtils.getDate12(tradingDay));

dayTradVol.add(turnovervolume);

tradVol.add(dayTradVol);

}


//添加均线数据

if("1".equalsIgnoreCase(isAverage)){

if(jydbDataServiceImpl.indexFiveAverage.get(secucode+"_"+DateFormatUtils.getDate12(tradingDay)) != null){

List average5day = new ArrayList();

average5day.add(DateFormatUtils.getDate12(tradingDay));
average5day.add(jydbDataServiceImpl.indexFiveAverage.get(secucode+"_"+DateFormatUtils.getDate12(tradingDay)));

average5.add(average5day);

}

if(jydbDataServiceImpl.indexTwentyAverage.get(secucode+"_"+DateFormatUtils.getDate12(tradingDay)) != null){

List average20day = new ArrayList();

average20day.add(DateFormatUtils.getDate12(tradingDay));

average20day.add(jydbDataServiceImpl.indexTwentyAverage.get(secucode+"_"+DateFormatUtils.getDate12(tradingDay)));

average20.add(average20day);

}

}

}
Map average = new HashMap();

if(average5.size() > 0){

average.put("MA5",average5);

}

if(average20.size() > 0){

average.put("MA20",average20);

}

if(average.size() > 0){

map.put("average", average);

}

map.put("quoteList", quoteList);

if(tradVol.size() > 0){

map.put("tradVol", tradVol);
}

if(secuabbr != null){

map.put("title", secuabbr+"("+secucode+")");

}else{

map.put("title", secucode);

}

return JsonUtil.toJson(map);

}

/**
* K线图绘画工厂
* 单k线
* @param params
* @return 图片存放路径
*/
private String kChartPlant(Map<String, String> params) {
String path = null;
try{
//获取绘图数据
String data = params.get("data");


Map<String, Object> datas = (Map<String, Object>) JsonUtil.parse(data);
//获取标题
String title = (String) datas.get("title");


OHLCSeriesCollection seriesCollection = new OHLCSeriesCollection();//定义k线图数据集
OHLCSeries series1 = new OHLCSeries("k_up");//高开低收数据序列,股票K线图的四个数据,依次是开,高,低,收
OHLCSeries series2 = new OHLCSeries("k_down");//定义上涨和下跌的两个数据集


//K线图数据
List<List<Object>> quoteList = (List<List<Object>>) datas.get("quoteList");


double mLow = 0d;
double mHigh = 0d;


//统计这段数据包含多少个交易日,好计算设置时间轴刻度规则
int days = 0;


String startDate = null;
String endDate = null;
int i = 0;


//获取所有工作日
List<Date> workDate = new ArrayList<Date>();


//添加k线图数据,添加成交量数据
for(List<Object> list : quoteList){
Date quoteListDate = DateFormatUtils.getDateTimeForAll12((String) list.get(0));
double open = Double.valueOf(list.get(1).toString());
double close = Double.valueOf(list.get(2).toString());
double high = Double.valueOf(list.get(3).toString());
double low = Double.valueOf(list.get(4).toString());
Calendar quoteCalendar = Calendar.getInstance();
quoteCalendar.setTimeInMillis(quoteListDate.getTime());


workDate.add(quoteListDate);


//取这段交易日内最高和最低价格
if(mHigh < high){
mHigh = high;
}
if(mLow > low){
mLow = low;
} else if(mLow == 0){
mLow = low;
}
if(i == 0){//拿到起始时间
startDate = (String) list.get(0);
}
if(i == quoteList.size() - 1){
endDate = (String) list.get(0);
}
if(open > close){
series2.add(new Day(quoteCalendar.get(quoteCalendar.DAY_OF_MONTH), quoteCalendar.get(quoteCalendar.MONTH) + 1, quoteCalendar.get(quoteCalendar.YEAR)), open, high, low, close);
} else {
series1.add(new Day(quoteCalendar.get(quoteCalendar.DAY_OF_MONTH), quoteCalendar.get(quoteCalendar.MONTH) + 1, quoteCalendar.get(quoteCalendar.YEAR)), open, high, low, close);
}
i++;
days++;
}


//将数据添加进数据集合
seriesCollection.addSeries(series1);
seriesCollection.addSeries(series2);


if(StringUtils.isBlank(params.get("startDate"))){
params.put("startDate", startDate);
}
if(StringUtils.isBlank(params.get("startDate"))){
params.put("endDate", endDate);
}
//获取所有节假日
List<Date> allHolidys = getAllHolidays(workDate);


//创建主题样式
StandardChartTheme standardChartTheme = new StandardChartTheme("CN");
//设置标题字体
standardChartTheme.setExtraLargeFont(new Font("微软雅黑",Font.BOLD,20));
//设置图例的字体
standardChartTheme.setRegularFont(new Font("微软雅黑",Font.PLAIN,15));
//应用主题样式
ChartFactory.setChartTheme(standardChartTheme);


//生成k线图画板
JFreeChart chart = ChartFactory.createCandlestickChart(title, null, null, seriesCollection, true);


CandlestickRenderer candlestickRender = new CandlestickRenderer();//设置K线图的画图器
candlestickRender.setUpPaint(Color.BLACK);//设置股票上涨的K线图颜色
candlestickRender.setDownPaint(Color.CYAN);//设置股票下跌的K线图颜色
candlestickRender.setSeriesPaint(1, Color.CYAN);//设置股票下跌的K线图颜色
candlestickRender.setSeriesPaint(0, Color.RED);//设置股票上涨的K线图颜色
candlestickRender.setAutoWidthMethod(CandlestickRenderer.WIDTHMETHOD_AVERAGE);//设置如何对K线图的宽度进行设定
candlestickRender.setAutoWidthGap(0.001);//设置各个K线图之间的间隔

candlestickRender.setSeriesVisibleInLegend(false);//设置不显示legend(数据颜色提示)
//设置k线图x轴,也就是时间轴
DateAxis domainAxis = new DateAxis();
domainAxis.setAutoRange(false);//设置不采用自动设置时间范围
//设置时间范围,注意,最大和最小时间设置时需要+ - 。否则时间刻度无法显示
Date da = DateFormatUtils.getDateTimeForAll12(endDate);
da.setTime(da.getTime() + 1);
Date sda = DateFormatUtils.getDateTimeForAll12(startDate);
sda.setTime(sda.getTime() - 1);
domainAxis.setRange(sda, da);


DateFormat df = new SimpleDateFormat("yyyy-MM-dd");
domainAxis.setAutoTickUnitSelection(false);//设置不采用自动选择刻度值
domainAxis.setTickMarkPosition(DateTickMarkPosition.START);//设置标记的位置
domainAxis.setLabelFont(new Font("微软雅黑", Font.BOLD, 12));
domainAxis.setStandardTickUnits(DateAxis.createStandardDateTickUnits());// 设置标准的时间刻度单位
domainAxis.setTickUnit(new DateTickUnit(DateTickUnit.DAY, days / Const.TIME_SCALE));// 设置时间刻度的间隔
domainAxis.setDateFormatOverride(df);//设置时间格式
SegmentedTimeline timeline = SegmentedTimeline.newMondayThroughFridayTimeline();//设置时间线显示的规则,用这个方法摒除掉周六和周日这些没有交易的日期
//排除所有节假日
for(Date holiday : allHolidys){
timeline.addException(holiday);
}
domainAxis.setTimeline(timeline);
//设置Y轴
NumberAxis y1Axis = new NumberAxis();
y1Axis.setAutoRange(false);//设置不采用自动设置时间范围
y1Axis.setUpperMargin(0.5D);//设置向上边框距离
y1Axis.setLabelFont(new Font("微软雅黑", Font.BOLD, 12));
y1Axis.setRange(mLow - (mLow * Const.UP_OR_DOWN_RANGE), mHigh + (mHigh * Const.UP_OR_DOWN_RANGE));//设置y轴数据范围


XYPlot plot = (XYPlot) chart.getPlot();//生成画图细节
plot.setRenderer(candlestickRender);//设置画图器
plot.setBackgroundPaint(Color.BLACK);//设置曲线图背景色
plot.setDomainGridlinesVisible(false);//不显示网格
plot.setRangeGridlinePaint(Color.RED);//设置间距格线颜色为红色
plot.setDomainAxis(domainAxis);//设置x轴
plot.setRangeAxis(y1Axis);//设置y轴


Calendar calendar = Calendar.getInstance();
calendar.setTimeInMillis(System.currentTimeMillis());
int day = calendar.get(Calendar.DAY_OF_MONTH);
int month = calendar.get(Calendar.MONTH) + 1;
int year = calendar.get(Calendar.YEAR);
String file_path = PropertiesRead.getinstance().getValue("FILE_PATH");
path = year + "-" + month + "-" + day + "/" + Uuid.getUUID() + "k.png";
file_path = file_path + path;
saveChartAsJPEG(chart, file_path);
} catch (Exception e) {
logger.warn("kChartPlant:------------Exception--------------");
logger.warn(e);
e.printStackTrace();
}
return path;
}


/**

* 组合图绘画工厂

* K线图 + 柱状图

* @param params

* @return 图片存放路径

*/

private String kBarChartPlant(Map<String, String> params) {

String path = null;

try{

//获取绘图数据

String data = params.get("data");

Map<String, Object> datas = (Map<String, Object>) JsonUtil.parse(data);

//获取标题

String title = (String) datas.get("title");


OHLCSeriesCollection seriesCollection = new OHLCSeriesCollection();//定义k线图数据集

OHLCSeries series1 = new OHLCSeries("k_up");//高开低收数据序列,股票K线图的四个数据,依次是开,高,低,收

OHLCSeries series2 = new OHLCSeries("k_down");//定义上涨和下跌的两个数据集


TimeSeriesCollection timeSeriesCollection = new TimeSeriesCollection();//保留成交量数据的集合

TimeSeries series3 = new TimeSeries("bar_up");//对应时间成交量数据

TimeSeries series4 = new TimeSeries("bar_down");//对应时间成交量数据
//K线图数据

List<List<Object>> quoteList = (List<List<Object>>) datas.get("quoteList");


//成交量数据

List<List<Object>> tradVol = (List<List<Object>>) datas.get("tradVol");


double mLow = 0d;

double mHigh = 0d;


//统计这段数据包含多少个交易日,好计算设置时间轴刻度规则
int days = 0;


String startDate = null;

String endDate = null;


//获取所有工作日

List<Date> workDate = new ArrayList<Date>();

//添加k线图数据,添加成交量数据

for(int i = 0; i < quoteList.size(); i++){

Date quoteListDate = DateFormatUtils.getDateTimeForAll12((String) quoteList.get(i).get(0));

double open = Double.valueOf(quoteList.get(i).get(1).toString());

double close = Double.valueOf(quoteList.get(i).get(2).toString());

double high = Double.valueOf(quoteList.get(i).get(3).toString());

double low = Double.valueOf(quoteList.get(i).get(4).toString());

Calendar quoteCalendar = Calendar.getInstance();

quoteCalendar.setTimeInMillis(quoteListDate.getTime());
Date tradVolDate = DateFormatUtils.getDateTimeForAll12((String) tradVol.get(i).get(0));

double vol = Double.valueOf(tradVol.get(i).get(1).toString());


Calendar volCalendar = Calendar.getInstance();

volCalendar.setTimeInMillis(tradVolDate.getTime());


workDate.add(quoteListDate);


//取这段交易日内最高和最低价格

if(mHigh < high){

mHigh = high;

}

if(mLow > low){

mLow = low;

} else if(mLow == 0){

mLow = low;
}

if(i == 0){//拿到起始时间

startDate = (String) quoteList.get(i).get(0);

}

if(i == quoteList.size() - 1){

endDate = (String) quoteList.get(i).get(0);

}


if(open > close){

series2.add(new Day(quoteCalendar.get(quoteCalendar.DAY_OF_MONTH), quoteCalendar.get(quoteCalendar.MONTH) + 1, quoteCalendar.get(quoteCalendar.YEAR)), open, high, low, close);

series4.add(new Day(volCalendar.get(volCalendar.DAY_OF_MONTH), volCalendar.get(volCalendar.MONTH) + 1, volCalendar.get(volCalendar.YEAR)), vol);

} else {
series1.add(new Day(quoteCalendar.get(quoteCalendar.DAY_OF_MONTH), quoteCalendar.get(quoteCalendar.MONTH) + 1, quoteCalendar.get(quoteCalendar.YEAR)), open, high, low, close);

series3.add(new Day(volCalendar.get(volCalendar.DAY_OF_MONTH), volCalendar.get(volCalendar.MONTH) + 1, volCalendar.get(volCalendar.YEAR)), vol);

}


days++;

}


//将数据添加进数据集合

seriesCollection.addSeries(series1);

seriesCollection.addSeries(series2);


timeSeriesCollection.addSeries(series3);

timeSeriesCollection.addSeries(series4);


if(StringUtils.isBlank(params.get("startDate"))){

params.put("startDate", startDate);

}
if(StringUtils.isBlank(params.get("startDate"))){

params.put("endDate", endDate);

}

//获取所有节假日

List<Date> allHolidys = getAllHolidays(workDate);


//设置k线图参数

CandlestickRenderer candlestickRender = new CandlestickRenderer();//设置K线图的画图器

candlestickRender.setUpPaint(Color.BLACK);//设置股票上涨的K线图颜色

candlestickRender.setDownPaint(Color.CYAN);//设置股票下跌的K线图颜色

candlestickRender.setSeriesPaint(1, Color.CYAN);//设置股票下跌的K线图颜色

candlestickRender.setSeriesPaint(0, Color.RED);//设置股票上涨的K线图颜色

candlestickRender.setAutoWidthMethod(CandlestickRenderer.WIDTHMETHOD_AVERAGE);//设置如何对K线图的宽度进行设定

candlestickRender.setAutoWidthGap(0.001);//设置各个K线图之间的间隔

candlestickRender.setSeriesVisibleInLegend(false);//设置不显示legend(数据颜色提示)


NumberAxis y1Axis=new NumberAxis();//设置Y轴,为数值,后面的设置,参考上面的y轴设置

y1Axis.setAutoRange(false);//设置不采用自动设置时间范围

y1Axis.setUpperMargin(0.5D);//设置向上边框距离
y1Axis.setLabelFont(new Font("微软雅黑", Font.BOLD, 12));

y1Axis.setRange(mLow - (mLow * Const.UP_OR_DOWN_RANGE), mHigh + (mHigh * Const.UP_OR_DOWN_RANGE));//设置y轴数据范围


//设置k线图x轴,也就是时间轴

DateAxis domainAxis = new DateAxis();

domainAxis.setAutoRange(false);//设置不采用自动设置时间范围

//设置时间范围,注意,最大和最小时间设置时需要+ - 。否则时间刻度无法显示

Date da = DateFormatUtils.getDateTimeForAll12(endDate);

da.setTime(da.getTime() + 1);

Date sda = DateFormatUtils.getDateTimeForAll12(startDate);

sda.setTime(sda.getTime() - 1);

domainAxis.setRange(sda, da);


DateFormat df = new SimpleDateFormat("yyyy-MM-dd");

domainAxis.setAutoTickUnitSelection(false);//设置不采用自动选择刻度值

domainAxis.setTickMarkPosition(DateTickMarkPosition.START);//设置标记的位置

domainAxis.setStandardTickUnits(DateAxis.createStandardDateTickUnits());// 设置标准的时间刻度单位

domainAxis.setTickUnit(new DateTickUnit(DateTickUnit.DAY, days / Const.TIME_SCALE));// 设置时间刻度的
domainAxis.setDateFormatOverride(df);//设置时间格式

SegmentedTimeline timeline = SegmentedTimeline.newMondayThroughFridayTimeline();//设置时间线显示的规则,用这个方法摒除掉周六和周日这些没有交易的日期

//排除所有节假日

for(Date holiday : allHolidys){

timeline.addException(holiday);

}

domainAxis.setTimeline(timeline);


XYPlot plot = new XYPlot(seriesCollection,domainAxis,y1Axis,candlestickRender);//生成画图细节

plot.setBackgroundPaint(Color.BLACK);//设置曲线图背景色

plot.setDomainGridlinesVisible(false);//不显示网格

plot.setRangeGridlinePaint(Color.RED);//设置间距格线颜色为红色


//设置柱状图参数

XYBarRenderer barRenderer = new XYBarRenderer();


barRenderer.setDrawBarOutline(true);//设置显示边框线

barRenderer.setBarPainter(new StandardXYBarPainter());//取消渐变效果

barRenderer.setMargin(0.3);//设置柱形图之间的间隔


barRenderer.setSeriesPaint(0, Color.BLACK);//设置柱子内部颜色

barRenderer.setSeriesPaint(1, Color.CYAN);//设置柱子内部颜色

barRenderer.setSeriesOutlinePaint(0, Color.RED);//设置柱子边框颜色

barRenderer.setSeriesOutlinePaint(1, Color.CYAN);//设置柱子边框颜色

barRenderer.setSeriesVisibleInLegend(false);//设置不显示legend(数据颜色提示)

barRenderer.setShadowVisible(false);//设置没有阴影


//设置柱状图y轴参数

NumberAxis y2Axis=new NumberAxis();//设置Y轴,为数值,后面的设置,参考上面的y轴设置

y2Axis.setLabelFont(new Font("微软雅黑", Font.BOLD, 12));//设置y轴字体

y2Axis.setAutoRange(true);//设置采用自动设置范围


XYPlot plot2 = new XYPlot(timeSeriesCollection, null, y2Axis, barRenderer);

plot2.setBackgroundPaint(Color.BLACK);//设置曲线图背景色
plot2.setDomainGridlinesVisible(false);//不显示网格

plot2.setRangeGridlinePaint(Color.RED);//设置间距格线颜色为红色

CombinedDomainXYPlot domainXYPlot = new CombinedDomainXYPlot(domainAxis);//建立一个恰当的联合图形区域对象,以x轴为共享轴

domainXYPlot.add(plot, 2);//添加图形区域对象,后面的数字是计算这个区域对象应该占据多大的区域2/3

domainXYPlot.add(plot2, 1);//添加图形区域对象,后面的数字是计算这个区域对象应该占据多大的区域2/3

domainXYPlot.setGap(10);//设置两个图形区域对象之间的间隔空间

JFreeChart chart = new JFreeChart(title, JFreeChart.DEFAULT_TITLE_FONT, domainXYPlot, true);


Calendar calendar = Calendar.getInstance();

calendar.setTimeInMillis(System.currentTimeMillis());

int day = calendar.get(Calendar.DAY_OF_MONTH);

int month = calendar.get(Calendar.MONTH) + 1;

int year = calendar.get(Calendar.YEAR);


String file_path = PropertiesRead.getinstance().getValue("FILE_PATH");
path = year + "-" + month + "-" + day + "/" + Uuid.getUUID() + "kBar.png";

file_path = file_path + path;

saveChartAsJPEG(chart, file_path);

} catch (Exception e) {

logger.warn("kBarChartPlant:------------Exception--------------");

logger.warn(e);

e.printStackTrace();

}

return path;

}
/**

* 组合图绘画工厂

* k线图 + 柱状图 + 折线图

* @param params

* @return 图片存放路径

*/

private String kBarLineChartPlant(Map<String, String> params) {

String path = null;

try{

//获取绘图数据

String data = params.get("data");


Map<String, Object> datas = (Map<String, Object>) JsonUtil.parse(data);

//获取标题

String title = (String) datas.get("title");


OHLCSeriesCollection seriesCollection = new OHLCSeriesCollection();//定义k线图数据集
OHLCSeries series1 = new OHLCSeries("");//高开低收数据序列,股票K线图的四个数据,依次是开,高,低,收

OHLCSeries series2 = new OHLCSeries("");//定义上涨和下跌的两个数据集


//K线图数据

List<List<Object>> quoteList = (List<List<Object>>) datas.get("quoteList");


//成交量数据

List<List<Object>> tradVol = (List<List<Object>>) datas.get("tradVol");


TimeSeriesCollection volSeriesCollection = new TimeSeriesCollection();//保留成交量数据的集合

TimeSeries series3 = new TimeSeries("");//对应时间成交量数据

TimeSeries series4 = new TimeSeries("");//对应时间成交量数据
double mLow = 0d;

double mHigh = 0d;


//统计这段数据包含多少个交易日,好计算设置时间轴刻度规则

int days = 0;


String startDate = null;

String endDate = null;


//所有工作日

List<Date> workDate = new ArrayList<Date>();

//添加k线图数据,添加成交量数据

for(int i = 0; i < quoteList.size(); i++){

Date quoteListDate = DateFormatUtils.getDateTimeForAll12((String) quoteList.get(i).get(0));

double open = Double.valueOf(quoteList.get(i).get(1).toString());

double close = Double.valueOf(quoteList.get(i).get(2).toString());

double high = Double.valueOf(quoteList.get(i).get(3).toString());

double low = Double.valueOf(quoteList.get(i).get(4).toString());
Calendar quoteCalendar = Calendar.getInstance();

quoteCalendar.setTimeInMillis(quoteListDate.getTime());


Date tradVolDate = DateFormatUtils.getDateTimeForAll12((String) tradVol.get(i).get(0));

double vol = Double.valueOf(tradVol.get(i).get(1).toString());


Calendar volCalendar = Calendar.getInstance();

volCalendar.setTimeInMillis(tradVolDate.getTime());


workDate.add(quoteListDate);


//取这段交易日内最高和最低价格

if(mHigh < high){

mHigh = high;

}
if(mLow > low){

mLow = low;

} else if(mLow == 0){

mLow = low;

}

if(i == 0){//拿到起始时间

startDate = (String) quoteList.get(i).get(0);

}

if(i == quoteList.size() - 1){

endDate = (String) quoteList.get(i).get(0);

}

if(open > close){

series2.add(new Day(quoteCalendar.get(quoteCalendar.DAY_OF_MONTH), quoteCalendar.get(quoteCalendar.MONTH) + 1, quoteCalendar.get(quoteCalendar.YEAR)), open, high, low, close);

series4.add(new Day(volCalendar.get(volCalendar.DAY_OF_MONTH), volCalendar.get(volCalendar.MONTH) + 1, volCalendar.get(volCalendar.YEAR)), vol);

} else {

series1.add(new Day(quoteCalendar.get(quoteCalendar.DAY_OF_MONTH), quoteCalendar.get(quoteCalendar.MONTH) + 1, quoteCalendar.get(quoteCalendar.YEAR)), open, high, low, close);

series3.add(new Day(volCalendar.get(volCalendar.DAY_OF_MONTH), volCalendar.get(volCalendar.MONTH) + 1, volCalendar.get(volCalendar.YEAR)), vol);

}
days++;

}


//k线图数据

seriesCollection.addSeries(series1);

seriesCollection.addSeries(series2);

//成交量数据

volSeriesCollection.addSeries(series3);

volSeriesCollection.addSeries(series4);


if(StringUtils.isBlank(params.get("startDate"))){

params.put("startDate", startDate);

}

if(StringUtils.isBlank(params.get("startDate"))){

params.put("endDate", endDate);
}

//获取所有节假日

List<Date> allHolidys = getAllHolidays(workDate);


//获取均线图数据

Map<String, List<List<Object>>> average = (Map<String, List<List<Object>>>) datas.get("average");


List<List<Object>> fiveDayAvg = average.get("MA5");//5天均线数据

List<List<Object>> twentyDayAvg = average.get("MA20");//20天均线数据


TimeSeriesCollection lineSeriesConllection = new TimeSeriesCollection();//保留均线图数据的集合

TimeSeries series5 = new TimeSeries("MA5");//对应时间成交量数据,5天

TimeSeries series6 = new TimeSeries("MA10");//对应时间成交量数据,10天

TimeSeries series7 = new TimeSeries("MA20");//对应时间成交量数据,20天
//添加均线图5天数据

if(fiveDayAvg != null){

for(List<Object> list : fiveDayAvg){

Date avgDate = DateFormatUtils.getDateTimeForAll12((String) list.get(0));

double avg = Double.valueOf(list.get(1).toString());


Calendar avgCalendar = Calendar.getInstance();

avgCalendar.setTimeInMillis(avgDate.getTime());

series5.add(new Day(avgCalendar.get(avgCalendar.DAY_OF_MONTH), avgCalendar.get(avgCalendar.MONTH) + 1, avgCalendar.get(avgCalendar.YEAR)), avg);

}

}

//添加均线图20天数据

if(twentyDayAvg != null){

for(List<Object> list : twentyDayAvg){

Date avgDate = DateFormatUtils.getDateTimeForAll12((String) list.get(0));

double avg = Double.valueOf(list.get(1).toString());


Calendar avgCalendar = Calendar.getInstance();
avgCalendar.setTimeInMillis(avgDate.getTime());

series7.add(new Day(avgCalendar.get(avgCalendar.DAY_OF_MONTH), avgCalendar.get(avgCalendar.MONTH) + 1, avgCalendar.get(avgCalendar.YEAR)), avg);

}

}

lineSeriesConllection.addSeries(series5);

lineSeriesConllection.addSeries(series6);

lineSeriesConllection.addSeries(series7);


//设置K线图的画图器

CandlestickRenderer candlestickRender = new CandlestickRenderer();

candlestickRender.setUpPaint(Color.BLACK);//设置股票上涨的K线图颜色

candlestickRender.setDownPaint(Color.CYAN);//设置股票下跌的K线图颜色

candlestickRender.setSeriesPaint(1, Color.CYAN);//设置股票下跌的K线图颜色

candlestickRender.setSeriesPaint(0, Color.RED);//设置股票上涨的K线图颜色

candlestickRender.setAutoWidthMethod(CandlestickRenderer.WIDTHMETHOD_AVERAGE);//设置如何对K线图的宽度进行设定

candlestickRender.setAutoWidthGap(0.001);//设置各个K线图之间的间隔
candlestickRender.setSeriesVisibleInLegend(false);//设置不显示legend(数据颜色提示)


//设置k线图y轴参数

NumberAxis y1Axis=new NumberAxis();//设置Y轴,为数值,后面的设置,参考上面的y轴设置

y1Axis.setAutoRange(false);//设置不采用自动设置数据范围

y1Axis.setUpperMargin(Const.UPPER_RANGE);//设置向上边框距离

y1Axis.setLabelFont(new Font("微软雅黑", Font.BOLD, 12));

y1Axis.setRange(mLow - (mLow * Const.UP_OR_DOWN_RANGE), mHigh + (mHigh * Const.UP_OR_DOWN_RANGE));//设置y轴数据范围

//        y1Axis.setAutoTickUnitSelection(true);//数据轴的数据标签是否自动确定(默认为true)


//设置k线图x轴,也就是时间轴

DateAxis domainAxis = new DateAxis();

domainAxis.setAutoRange(false);//设置不采用自动设置时间范围

//设置时间范围,注意,最大和最小时间设置时需要+ - 。否则时间刻度无法显示

Date da = DateFormatUtils.getDateTimeForAll12(endDate);

da.setTime(da.getTime() + 1);
Date sda = DateFormatUtils.getDateTimeForAll12(startDate);

sda.setTime(sda.getTime() - 1);

domainAxis.setRange(sda, da);

DateFormat df = new SimpleDateFormat("yyyy-MM-dd");


domainAxis.setAutoTickUnitSelection(false);//设置不采用自动选择刻度值

domainAxis.setTickMarkPosition(DateTickMarkPosition.START);//设置标记的位置

domainAxis.setStandardTickUnits(DateAxis.createStandardDateTickUnits());// 设置标准的时间刻度单位

domainAxis.setTickUnit(new DateTickUnit(DateTickUnit.DAY, days / Const.TIME_SCALE));// 设置时间刻度的间隔

domainAxis.setDateFormatOverride(df);//设置时间格式


SegmentedTimeline timeline = SegmentedTimeline.newMondayThroughFridayTimeline();//设置时间线显示
//排除所有节假日

for(Date holiday : allHolidys){

timeline.addException(holiday);

}

domainAxis.setTimeline(timeline);


//设置均线图画图器

XYLineAndShapeRenderer lineAndShapeRenderer = new XYLineAndShapeRenderer();

lineAndShapeRenderer.setBaseItemLabelsVisible(true);

lineAndShapeRenderer.setSeriesShapesVisible(0, false);//设置不显示数据点模型

lineAndShapeRenderer.setSeriesShapesVisible(1, false);

lineAndShapeRenderer.setSeriesShapesVisible(2, false);

lineAndShapeRenderer.setSeriesPaint(0, Color.WHITE);//设置均线颜色

lineAndShapeRenderer.setSeriesPaint(1, Color.YELLOW);

lineAndShapeRenderer.setSeriesPaint(2, Color.MAGENTA);

//生成画图细节 第一个和最后一个参数这里需要设置为null,否则画板加载不同类型的数据时会有类型错误异常

//可能是因为初始化时,构造器内会把统一数据集合设置为传参的数据集类型,画图器可能也是同样一个道理

XYPlot plot = new XYPlot(null,domainAxis,y1Axis,null);

plot.setBackgroundPaint(Color.BLACK);//设置曲线图背景色

plot.setDomainGridlinesVisible(false);//不显示网格

plot.setRangeGridlinePaint(Color.RED);//设置间距格线颜色为红色


//将设置好的数据集合和画图器放入画板

plot.setDataset(0, seriesCollection);

plot.setRenderer(0, candlestickRender);

plot.setDataset(1, lineSeriesConllection);

plot.setRenderer(1, lineAndShapeRenderer);

//设置柱状图参数

XYBarRenderer barRenderer = new XYBarRenderer();


barRenderer.setDrawBarOutline(true);//设置显示边框线

barRenderer.setBarPainter(new StandardXYBarPainter());//取消渐变效果

barRenderer.setMargin(0.3);//设置柱形图之间的间隔


barRenderer.setSeriesPaint(0, Color.BLACK);//设置柱子内部颜色

barRenderer.setSeriesPaint(1, Color.CYAN);//设置柱子内部颜色

barRenderer.setSeriesOutlinePaint(0, Color.RED);//设置柱子边框颜色

barRenderer.setSeriesOutlinePaint(1, Color.CYAN);//设置柱子边框颜色

barRenderer.setSeriesVisibleInLegend(false);//设置不显示legend(数据颜色提示)

barRenderer.setShadowVisible(false);//设置没有阴影

//设置柱状图y轴参数

NumberAxis y2Axis=new NumberAxis();//设置Y轴,为数值,后面的设置,参考上面的y轴设置

y2Axis.setLabelFont(new Font("微软雅黑", Font.BOLD, 12));//设置y轴字体

y2Axis.setAutoRange(true);//设置采用自动设置时间范围


//这里不设置x轴,x轴参数依照k线图x轴为模板

XYPlot plot2 = new XYPlot(volSeriesCollection, null, y2Axis, barRenderer);

plot2.setBackgroundPaint(Color.BLACK);//设置曲线图背景色

plot2.setDomainGridlinesVisible(false);//不显示网格

plot2.setRangeGridlinePaint(Color.RED);//设置间距格线颜色为红色


//建立一个恰当的联合图形区域对象,以x轴为共享轴

CombinedDomainXYPlot domainXYPlot = new CombinedDomainXYPlot(domainAxis);//

domainXYPlot.add(plot, 2);//添加图形区域对象,后面的数字是计算这个区域对象应该占据多大的区域2/3

domainXYPlot.add(plot2, 1);//添加图形区域对象,后面的数字是计算这个区域对象应该占据多大的区域1/3

domainXYPlot.setGap(10);//设置两个图形区域对象之间的间隔空间

//生成图纸
JFreeChart chart = new JFreeChart(title, new Font("微软雅黑", Font.BOLD, 24), domainXYPlot, true);


Calendar calendar = Calendar.getInstance();

calendar.setTimeInMillis(System.currentTimeMillis());

int day = calendar.get(Calendar.DAY_OF_MONTH);

int month = calendar.get(Calendar.MONTH) + 1;

int year = calendar.get(Calendar.YEAR);


String file_path = PropertiesRead.getinstance().getValue("FILE_PATH");

path = year + "-" + month + "-" + day + "/" + Uuid.getUUID() + "kLineBar.png";

file_path = file_path + path;

saveChartAsJPEG(chart, file_path);

} catch (Exception e) {

logger.warn("kBarLineChartPlant:------------Exception--------------");

logger.warn(e);

e.printStackTrace();

}

return path;

}


 5530
5530


 被折叠的 条评论
为什么被折叠?
被折叠的 条评论
为什么被折叠?
 到【灌水乐园】发言


